
- Create a Snowflake Notebook and connect it to a compute pool
- Install the Kumo SDK
- Build a graph from your data (three ways to do this)
- Run prediction queries using KumoRFM
Setup
Follow Steps 1–5 below to set up your notebook. These steps are the same regardless of which data source you use later.Step 1. Open Snowflake and go to Workspaces
Log in to your Snowflake account. In the left sidebar, click Projects, then click Workspaces.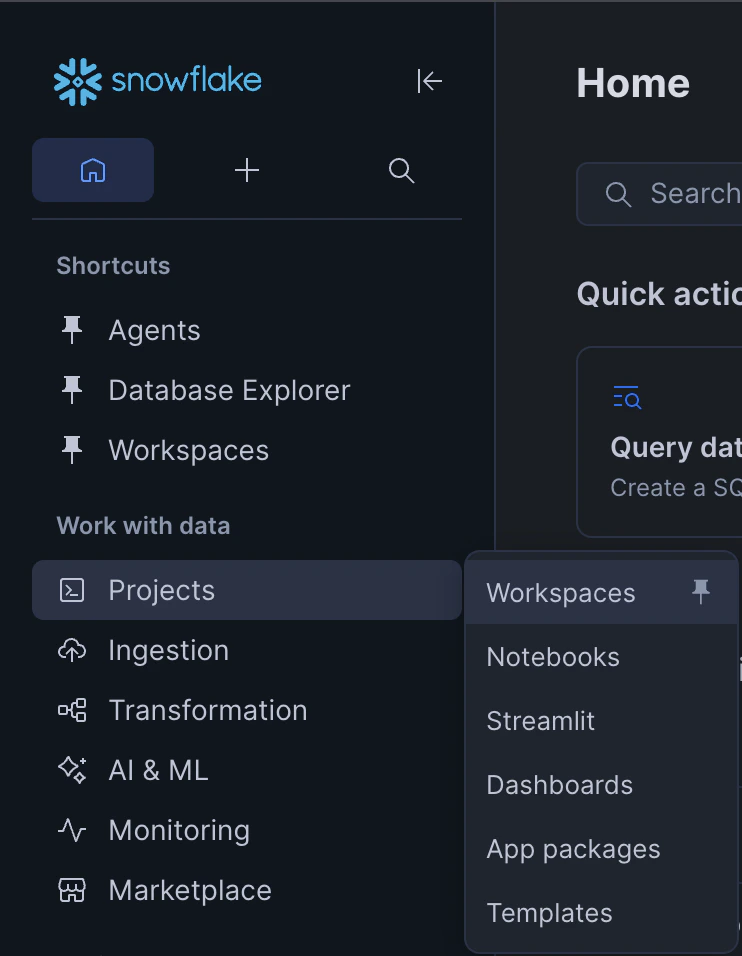
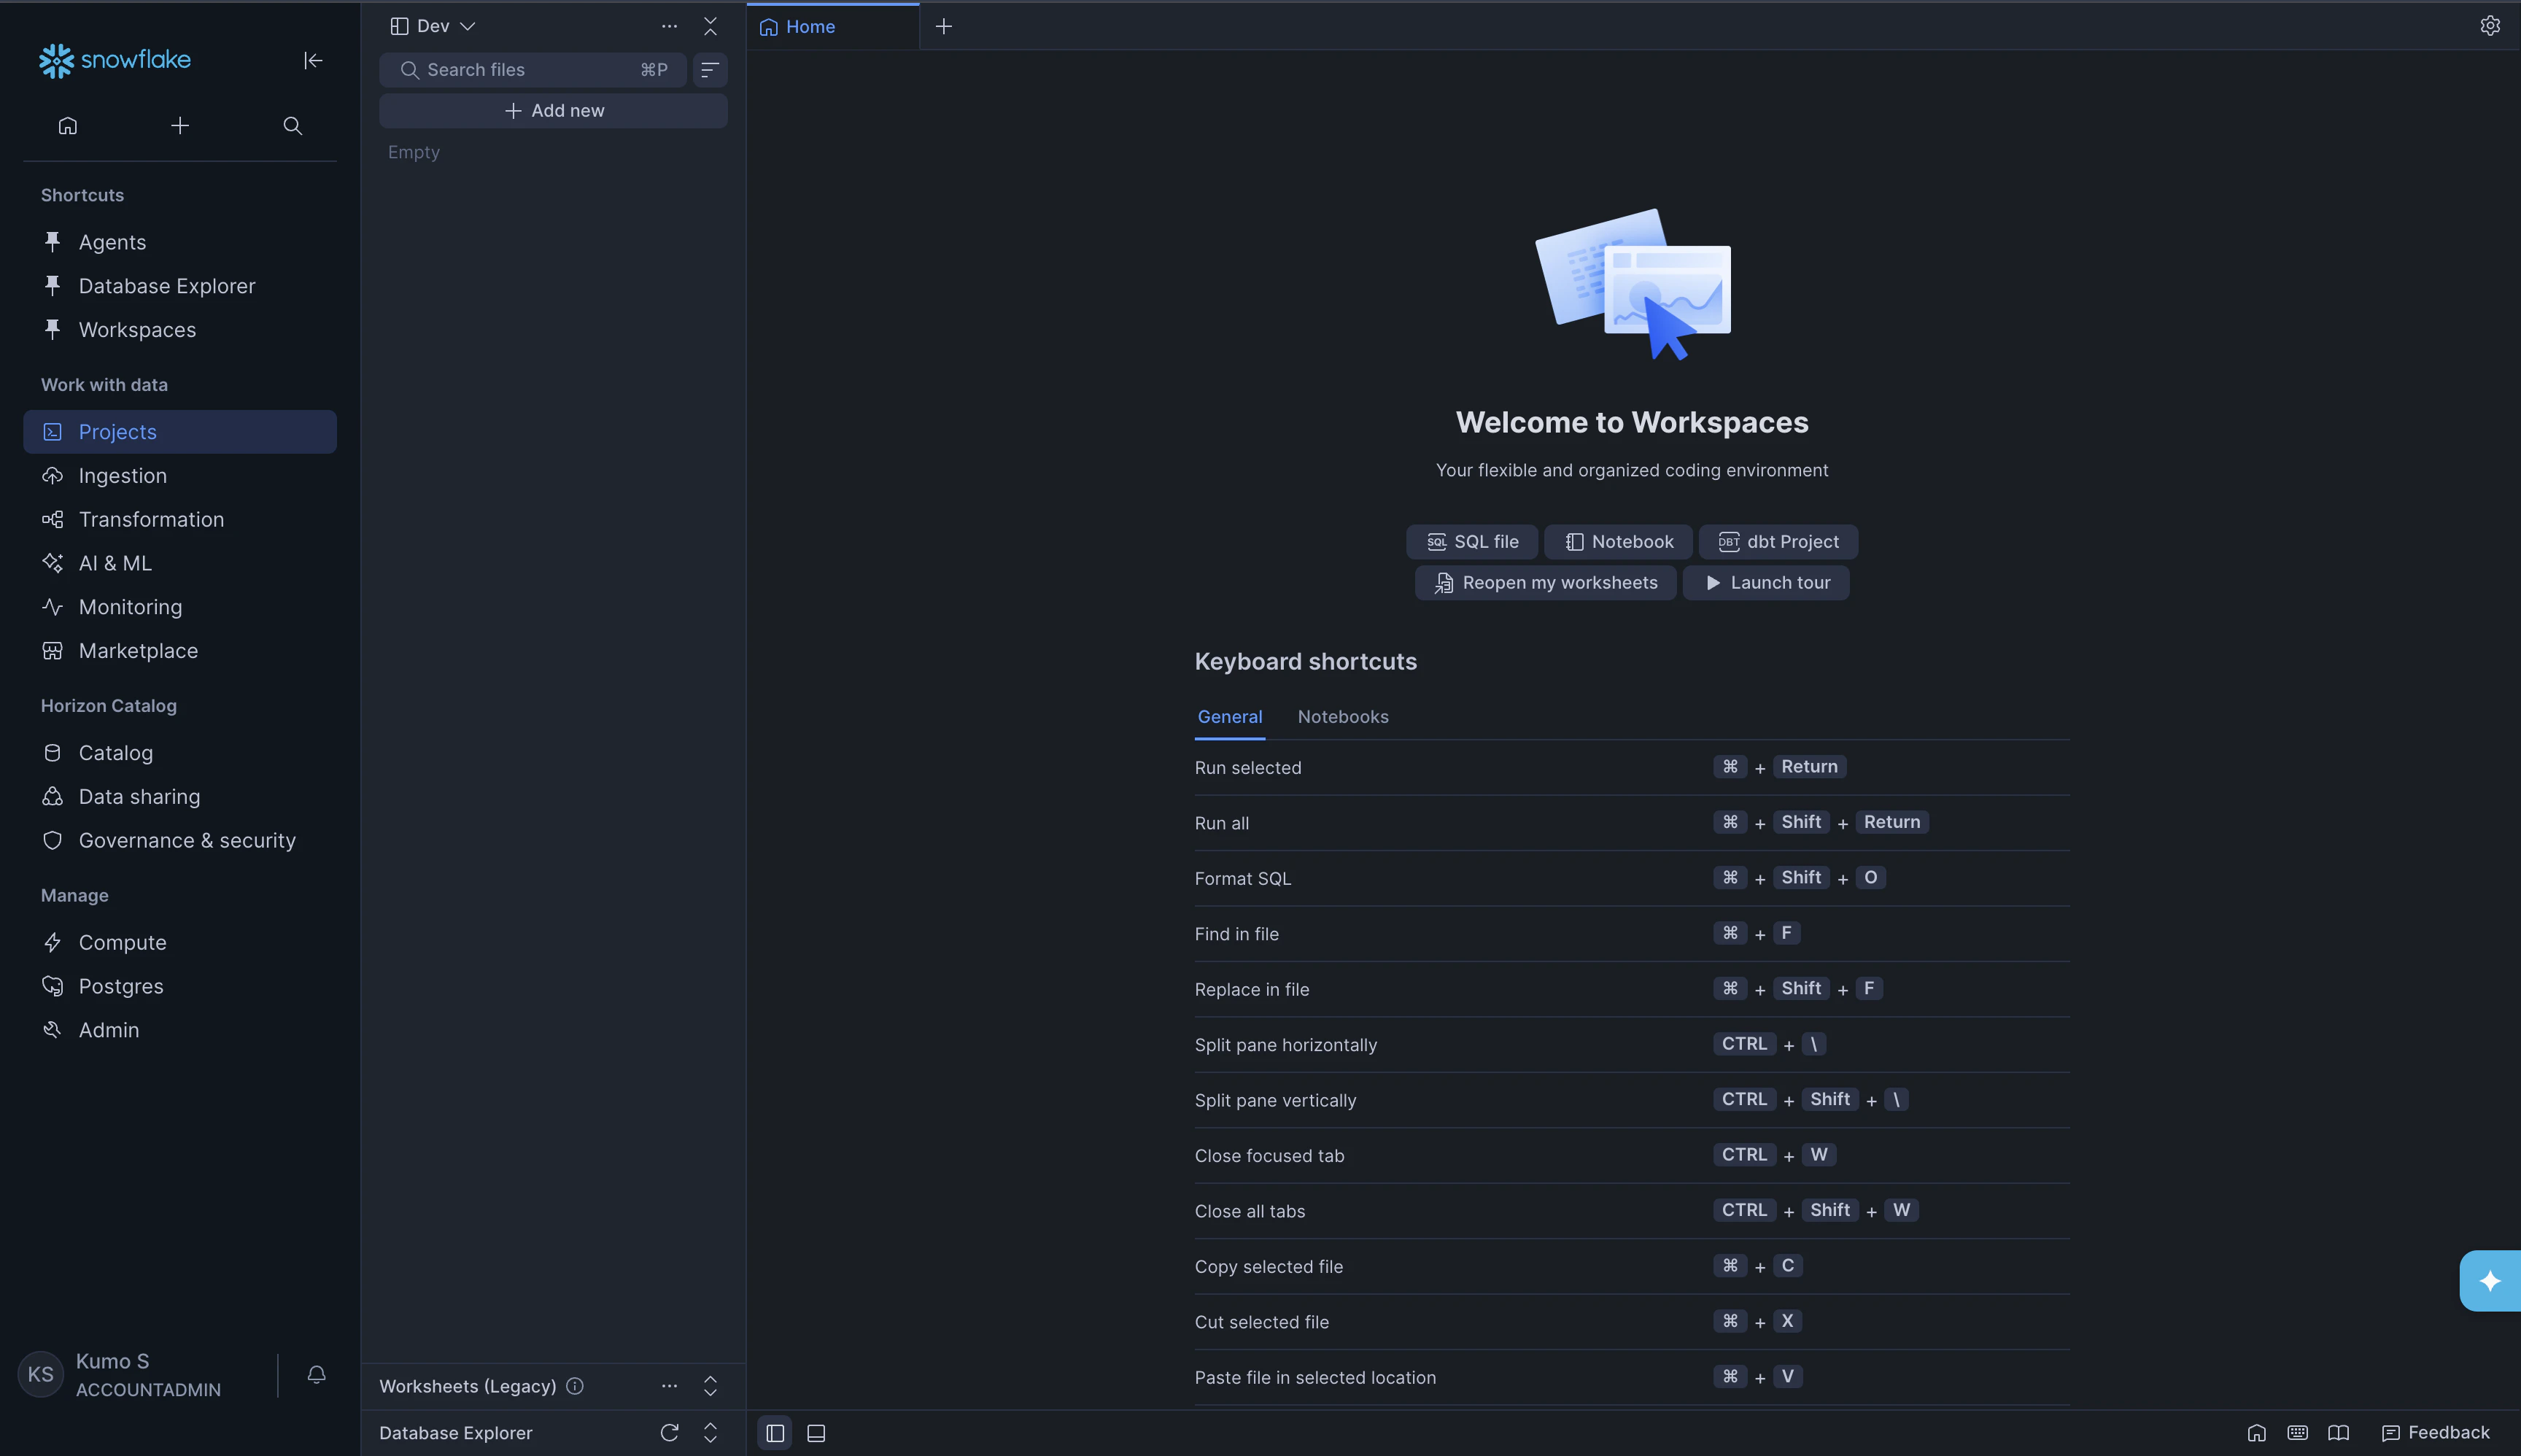
Step 2. Create a new Notebook
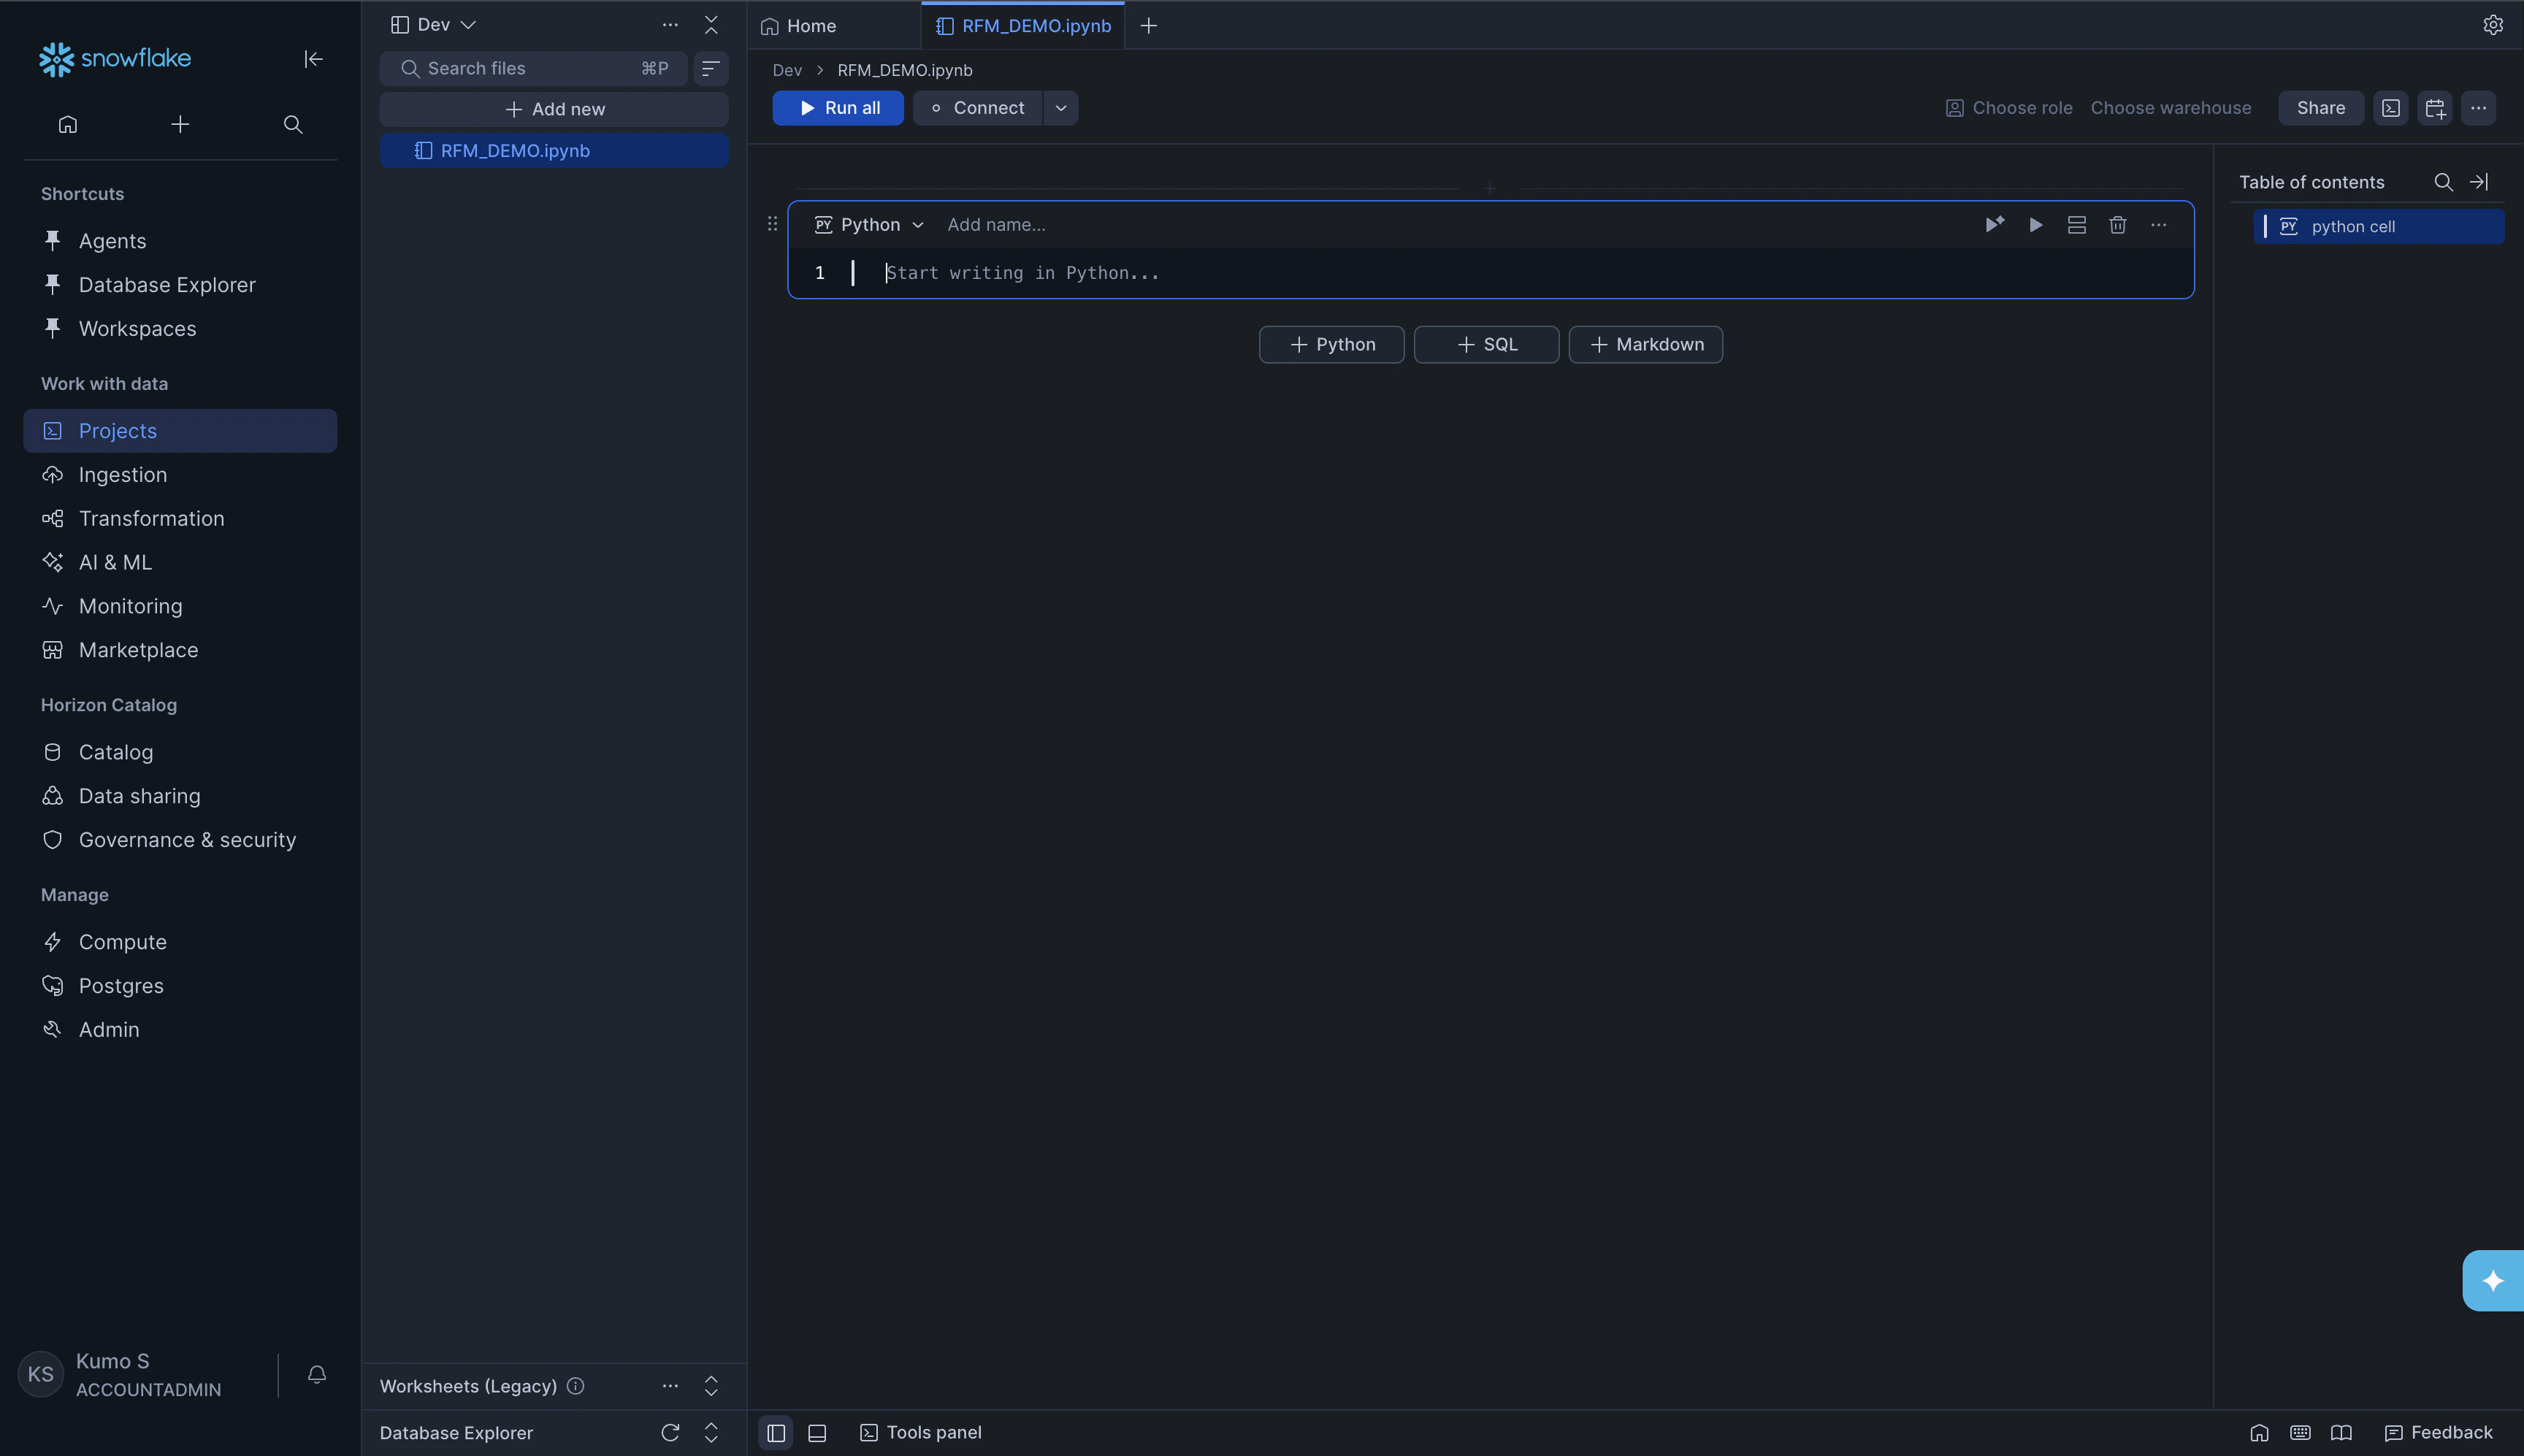
In the left panel, click + Add new. A dropdown menu will appear. Click Notebook.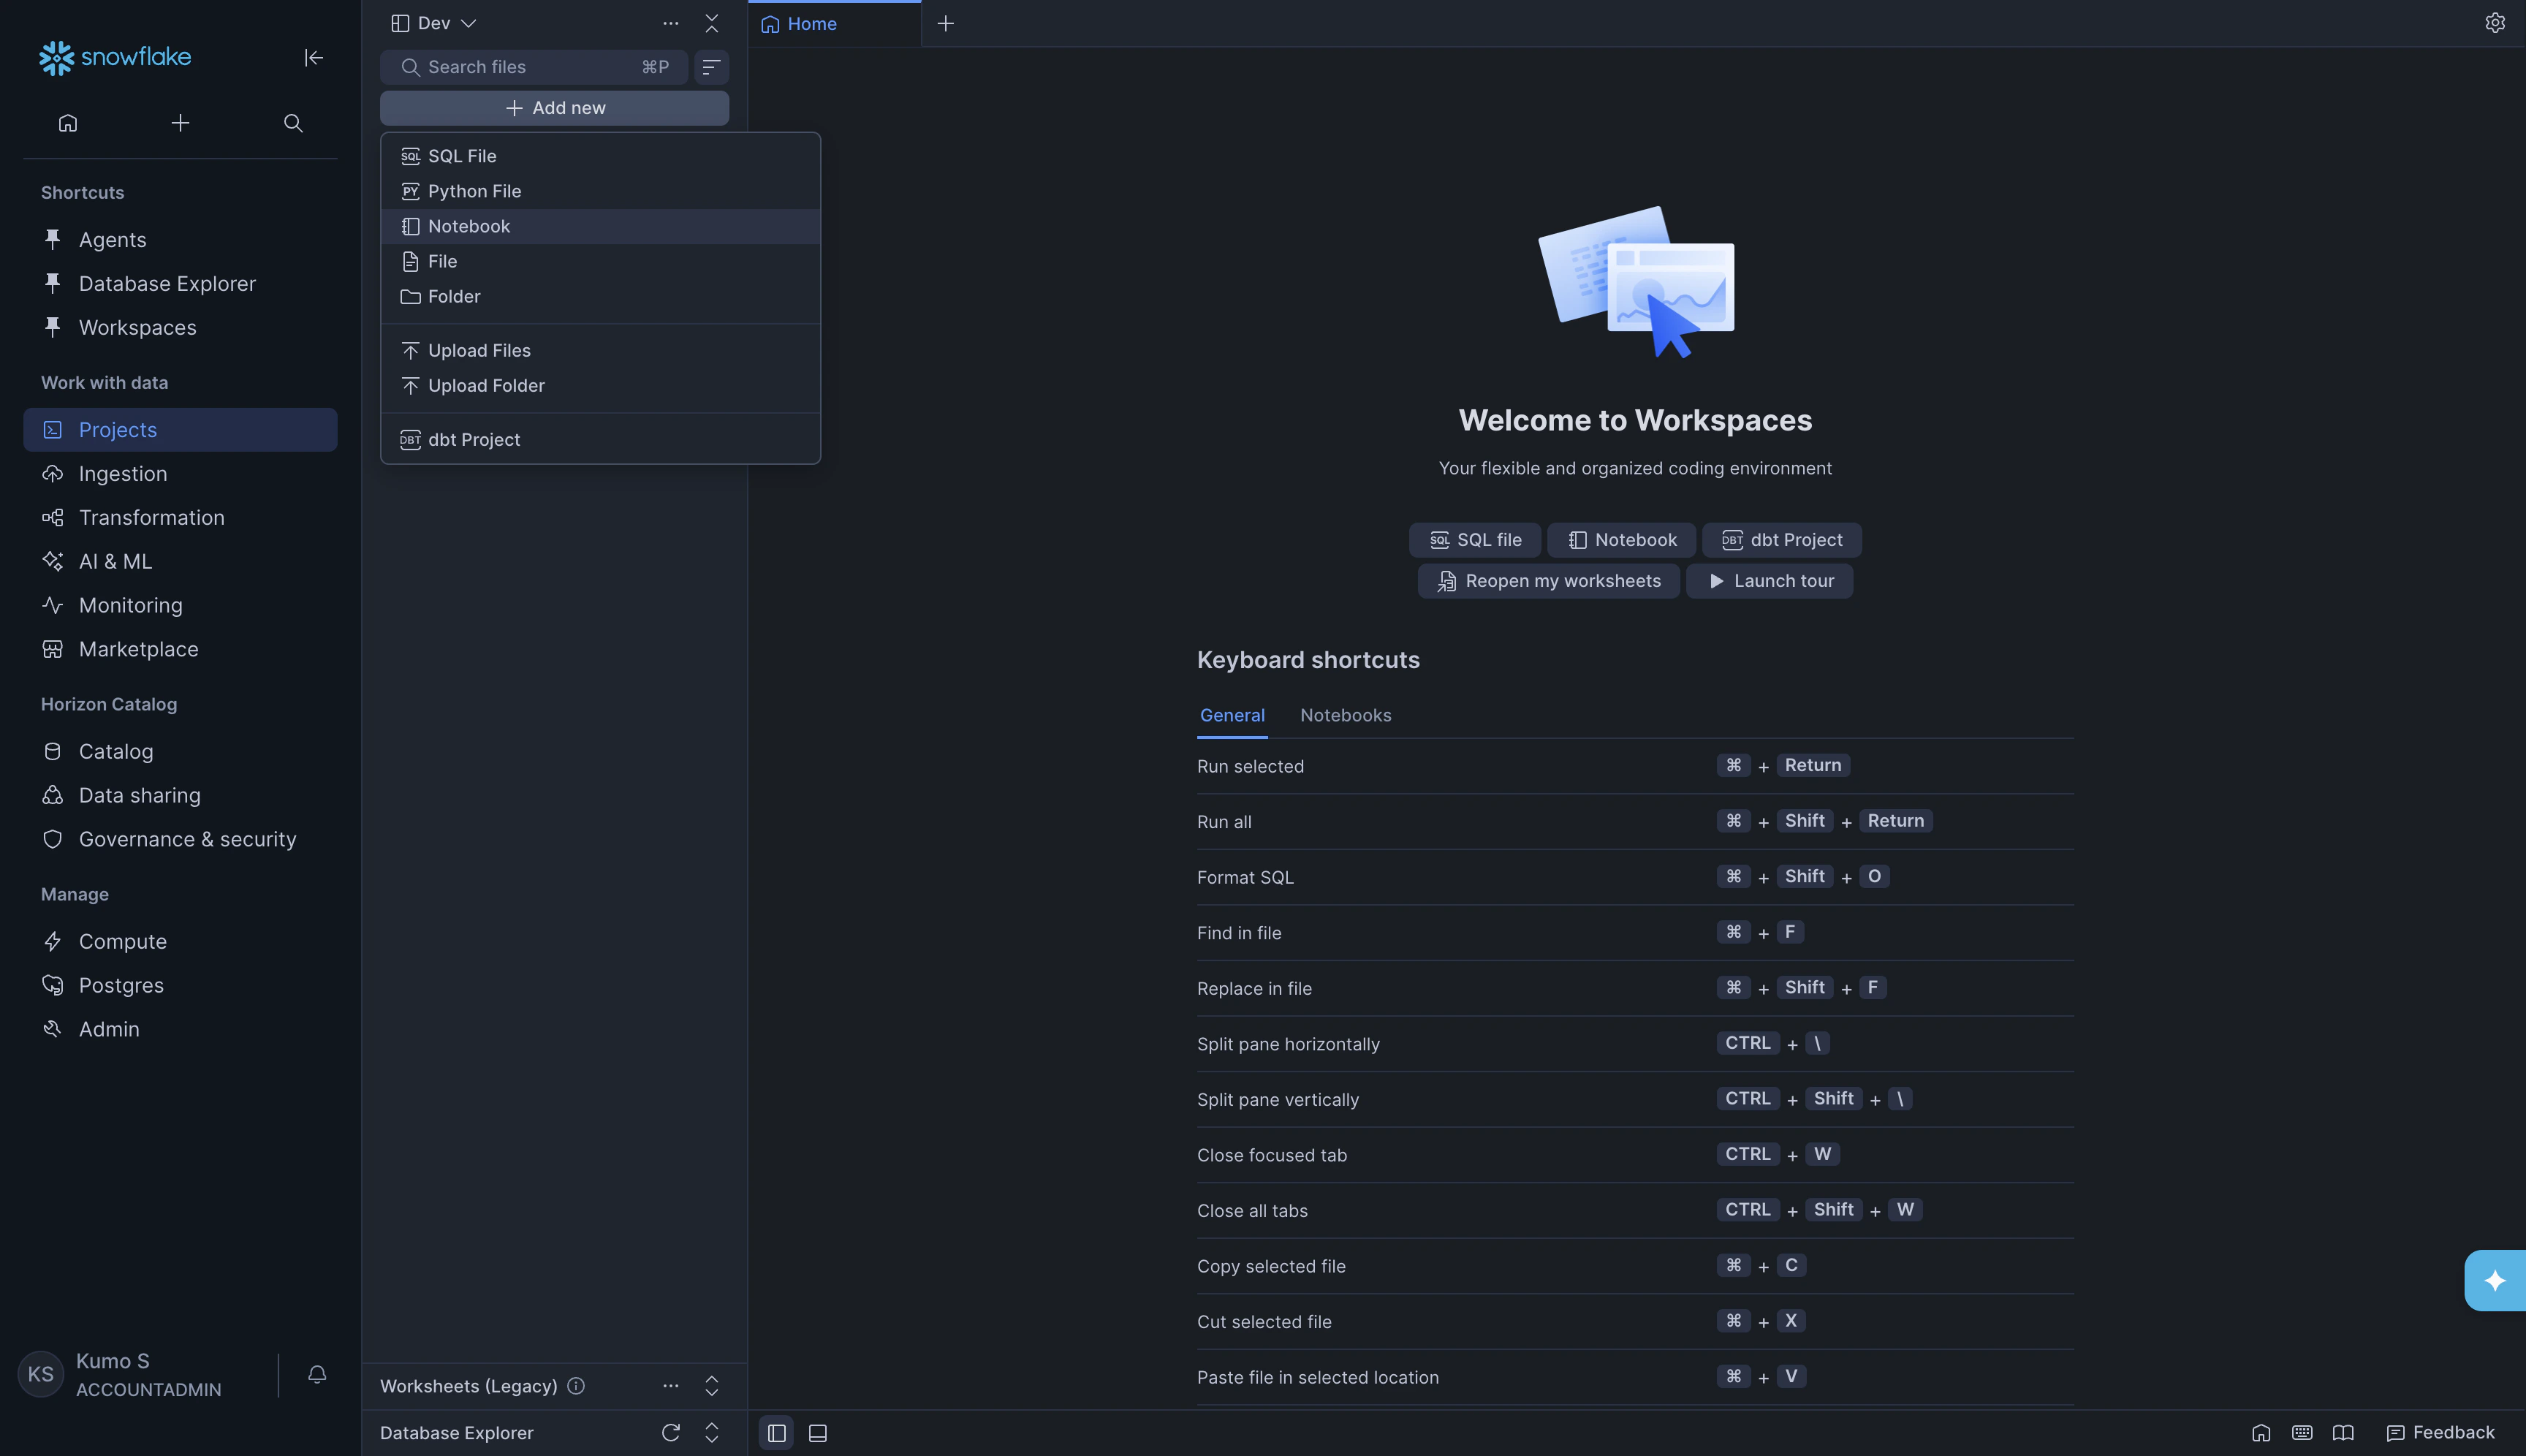
RFM_DEMO.ipynb).
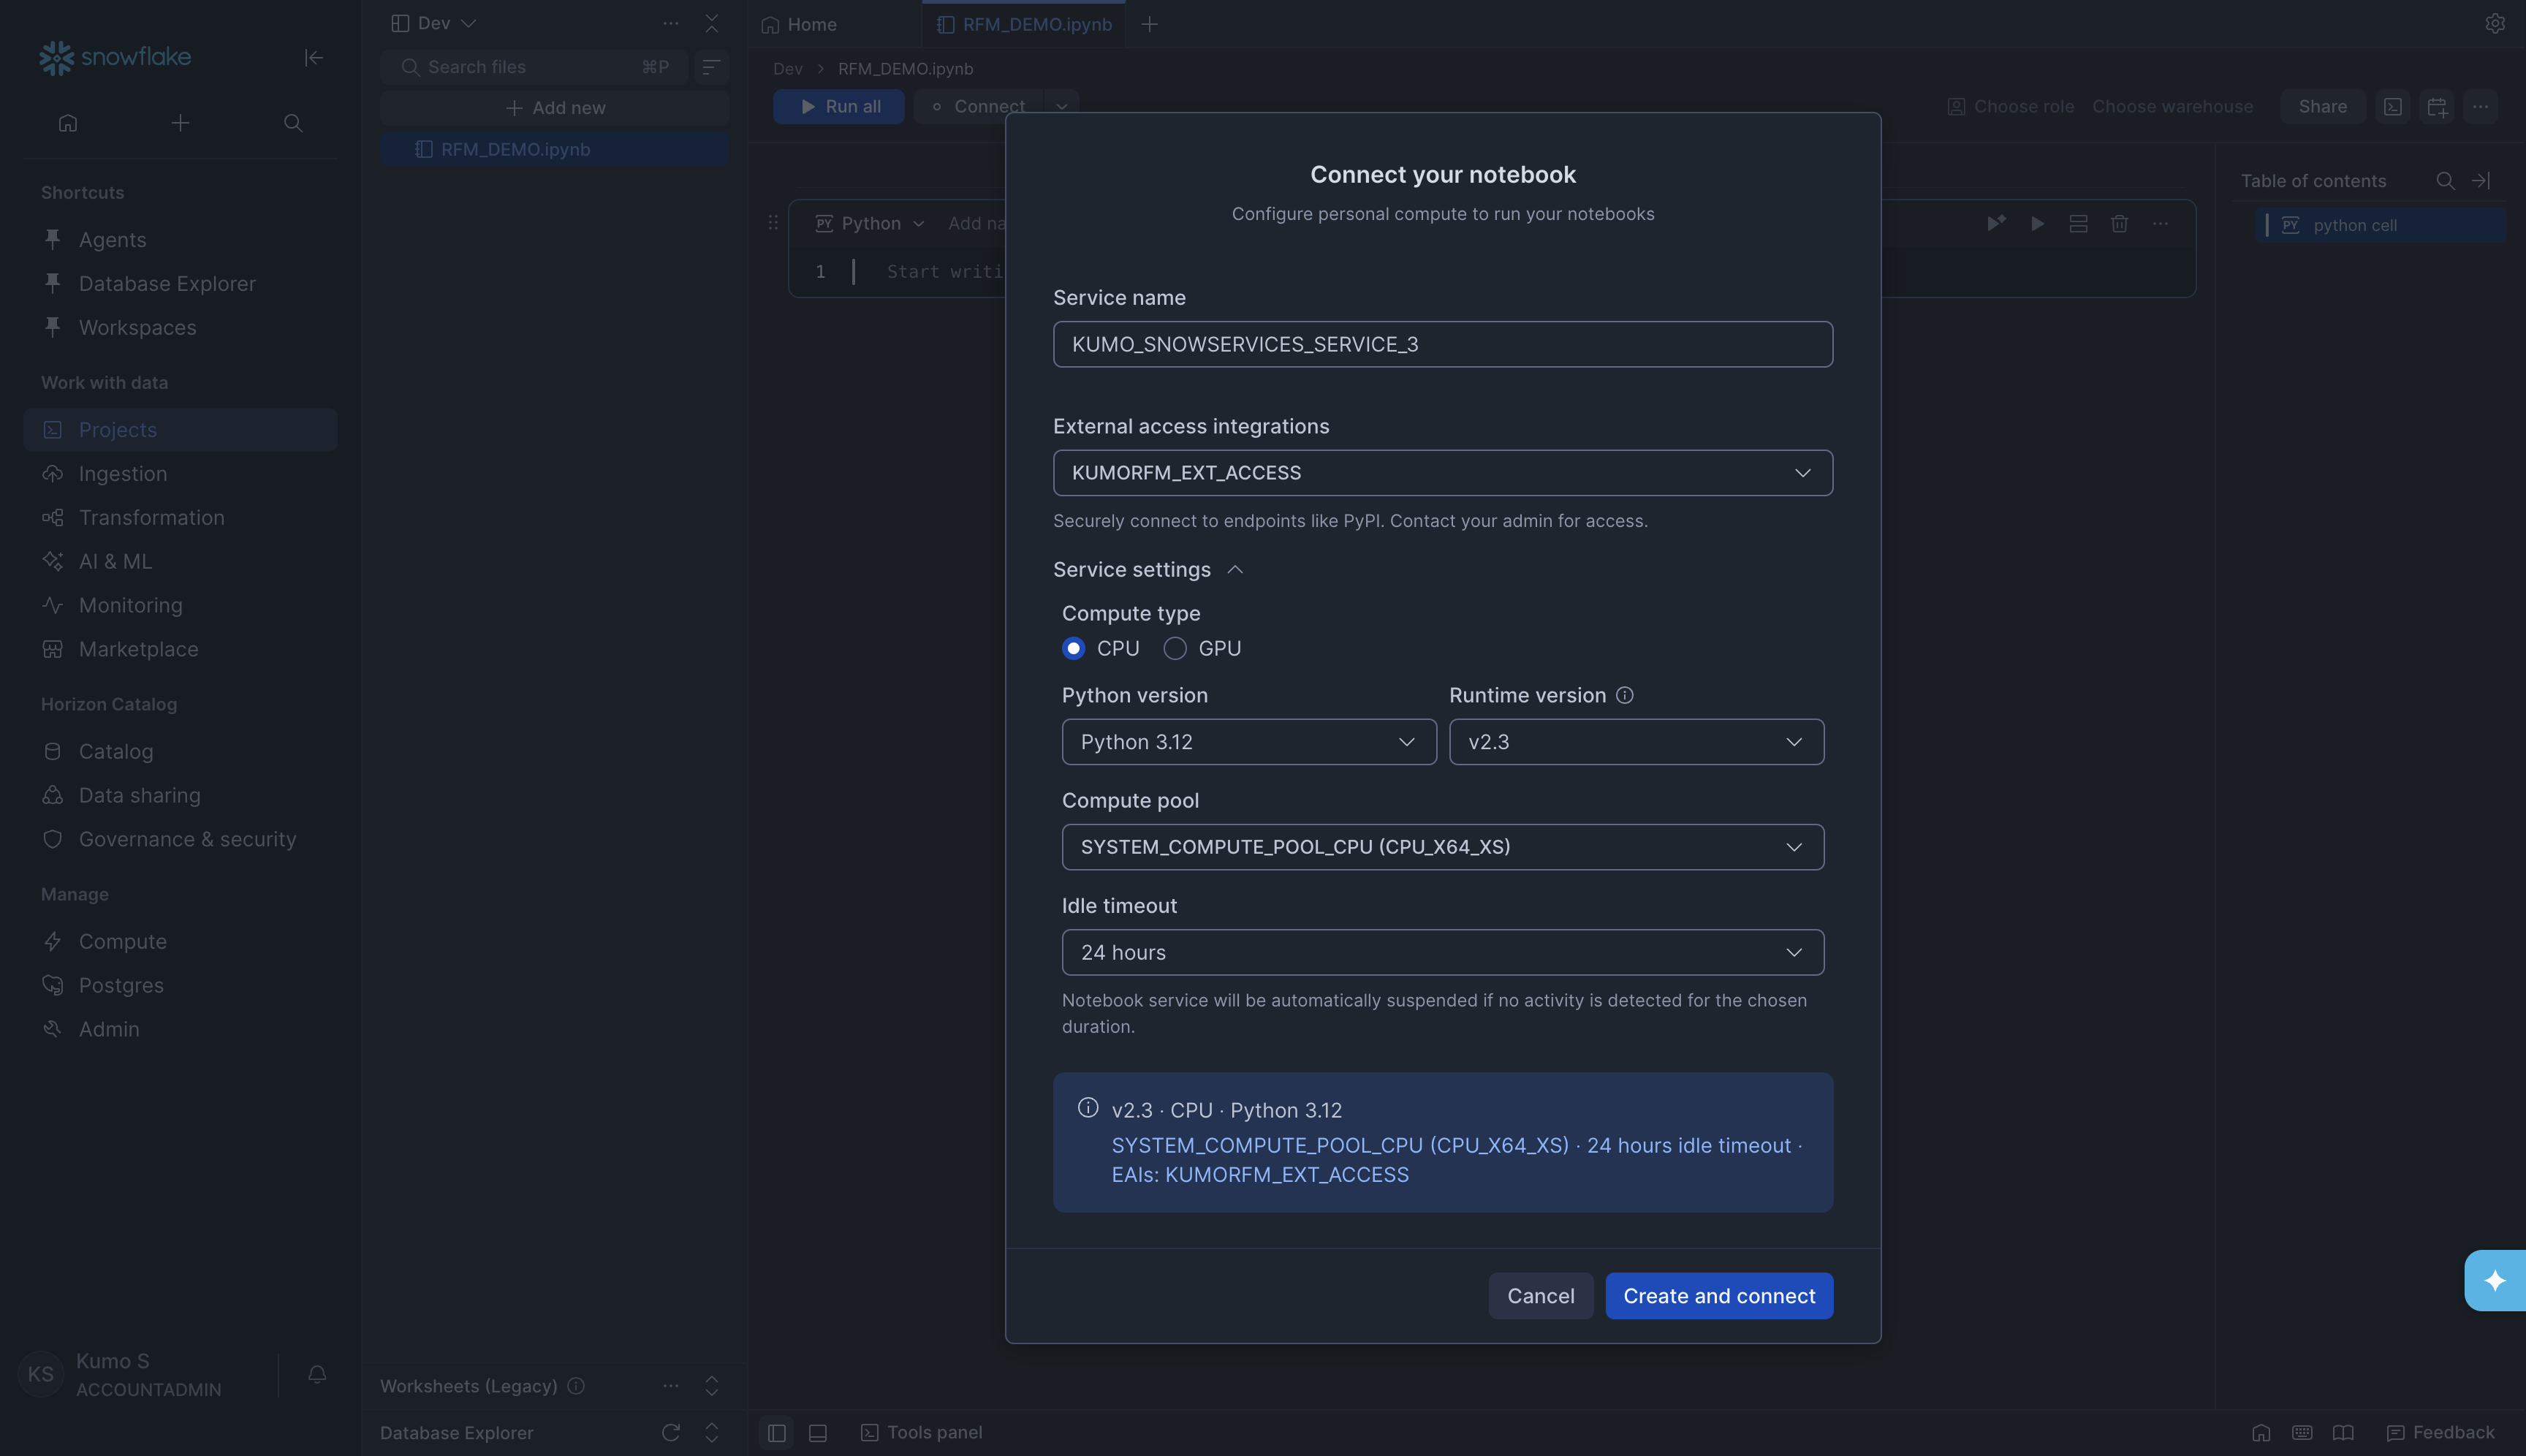
Step 3. Connect your Notebook
Before you can run any code, you need to connect the notebook to a compute resource. Click the Connect button at the top of the notebook. A dialog called Connect your notebook will appear. Fill in the following settings:
Click Create and connect. Wait for the status indicator at the top of the notebook to turn green (showing Connected).
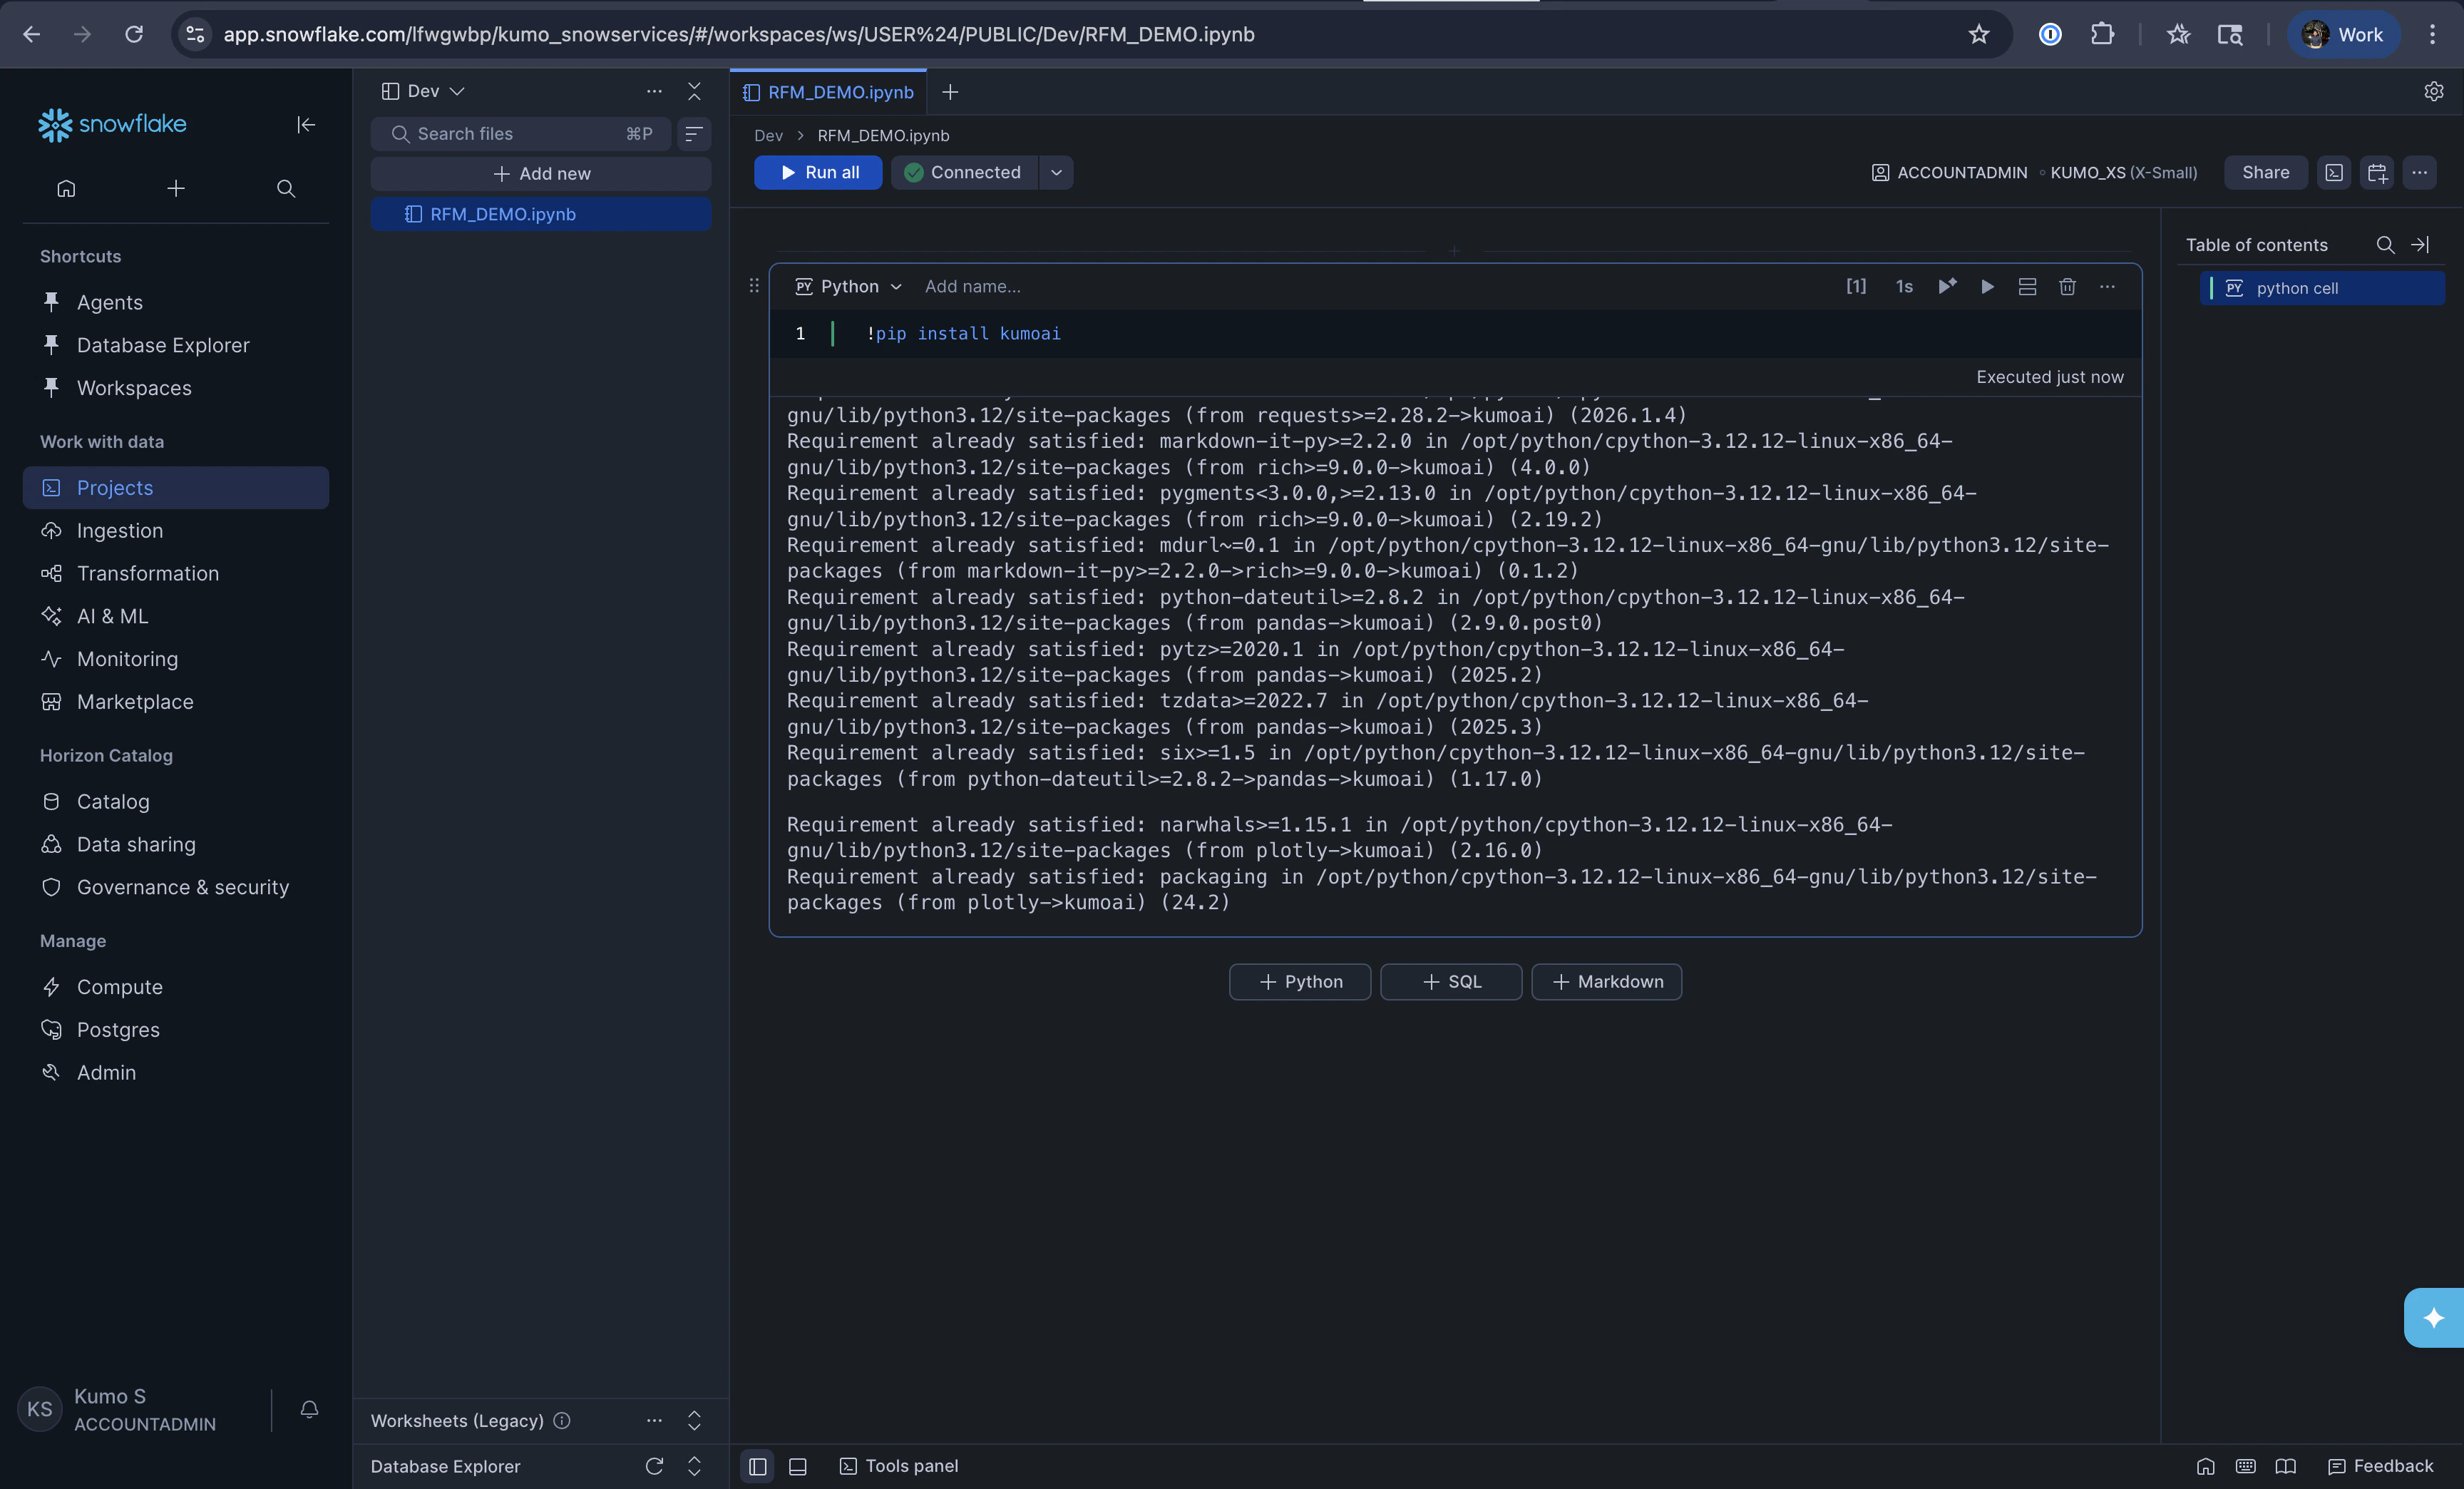
Step 4. Install the Kumo SDK
In the first cell of your notebook, install thekumoai package by running:
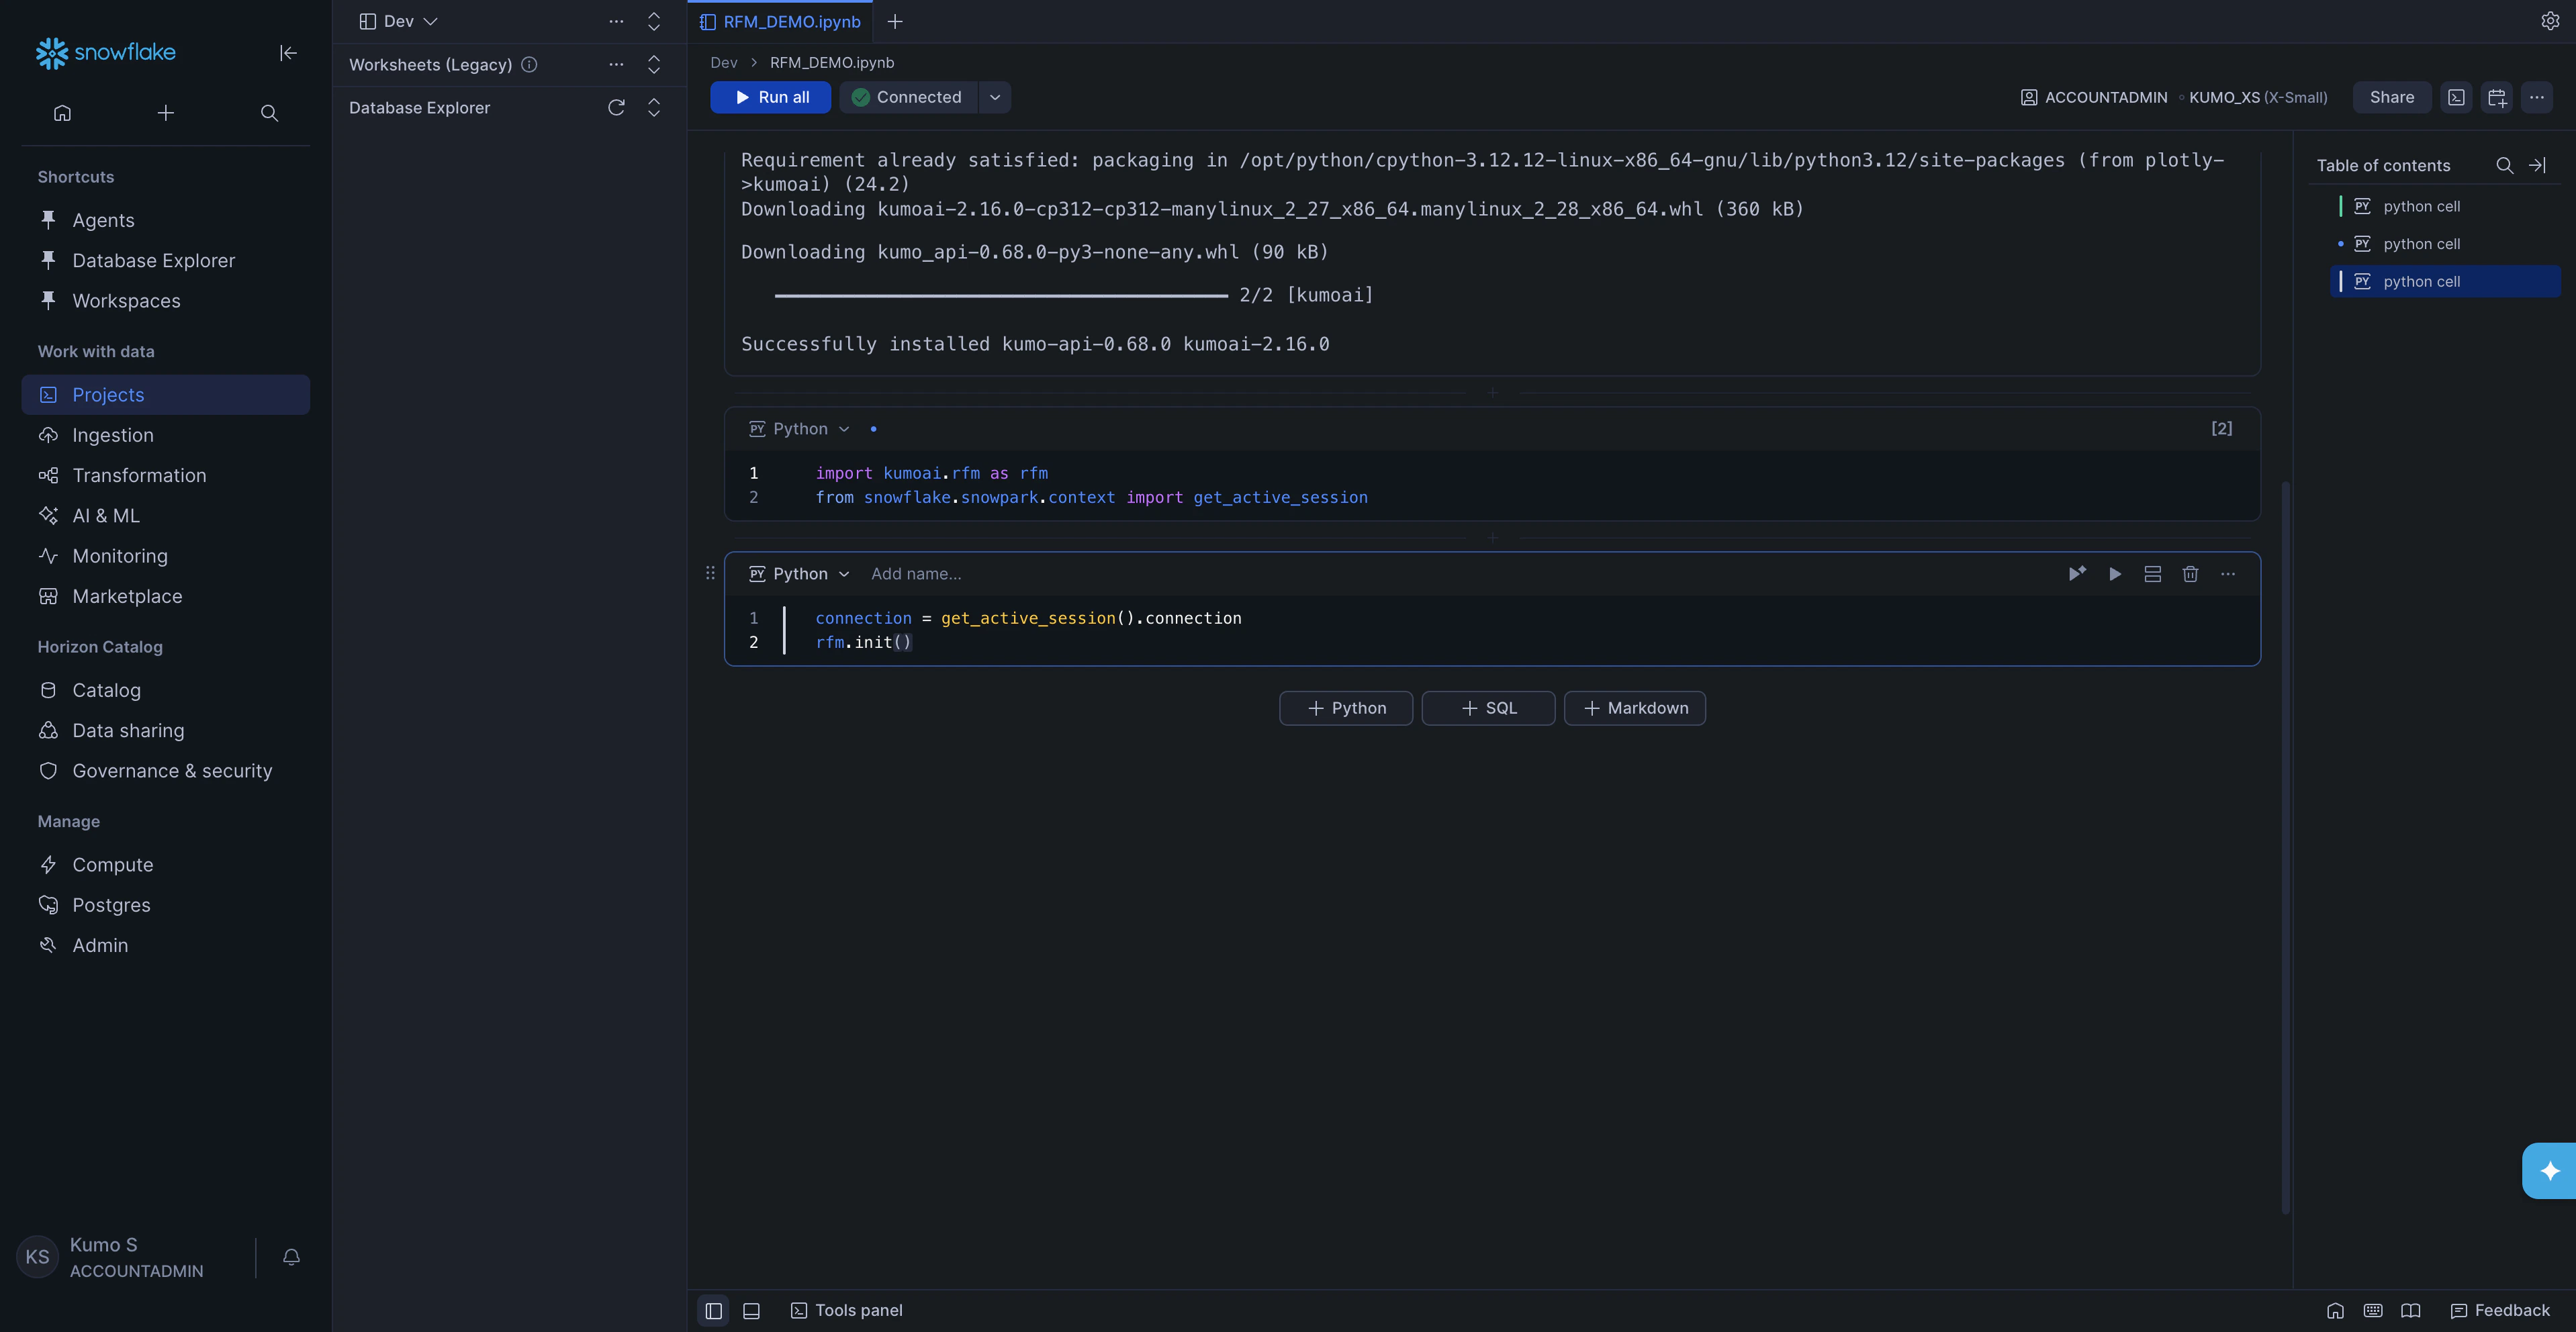
Step 5. Import and initialize
In the next cell, import the required modules: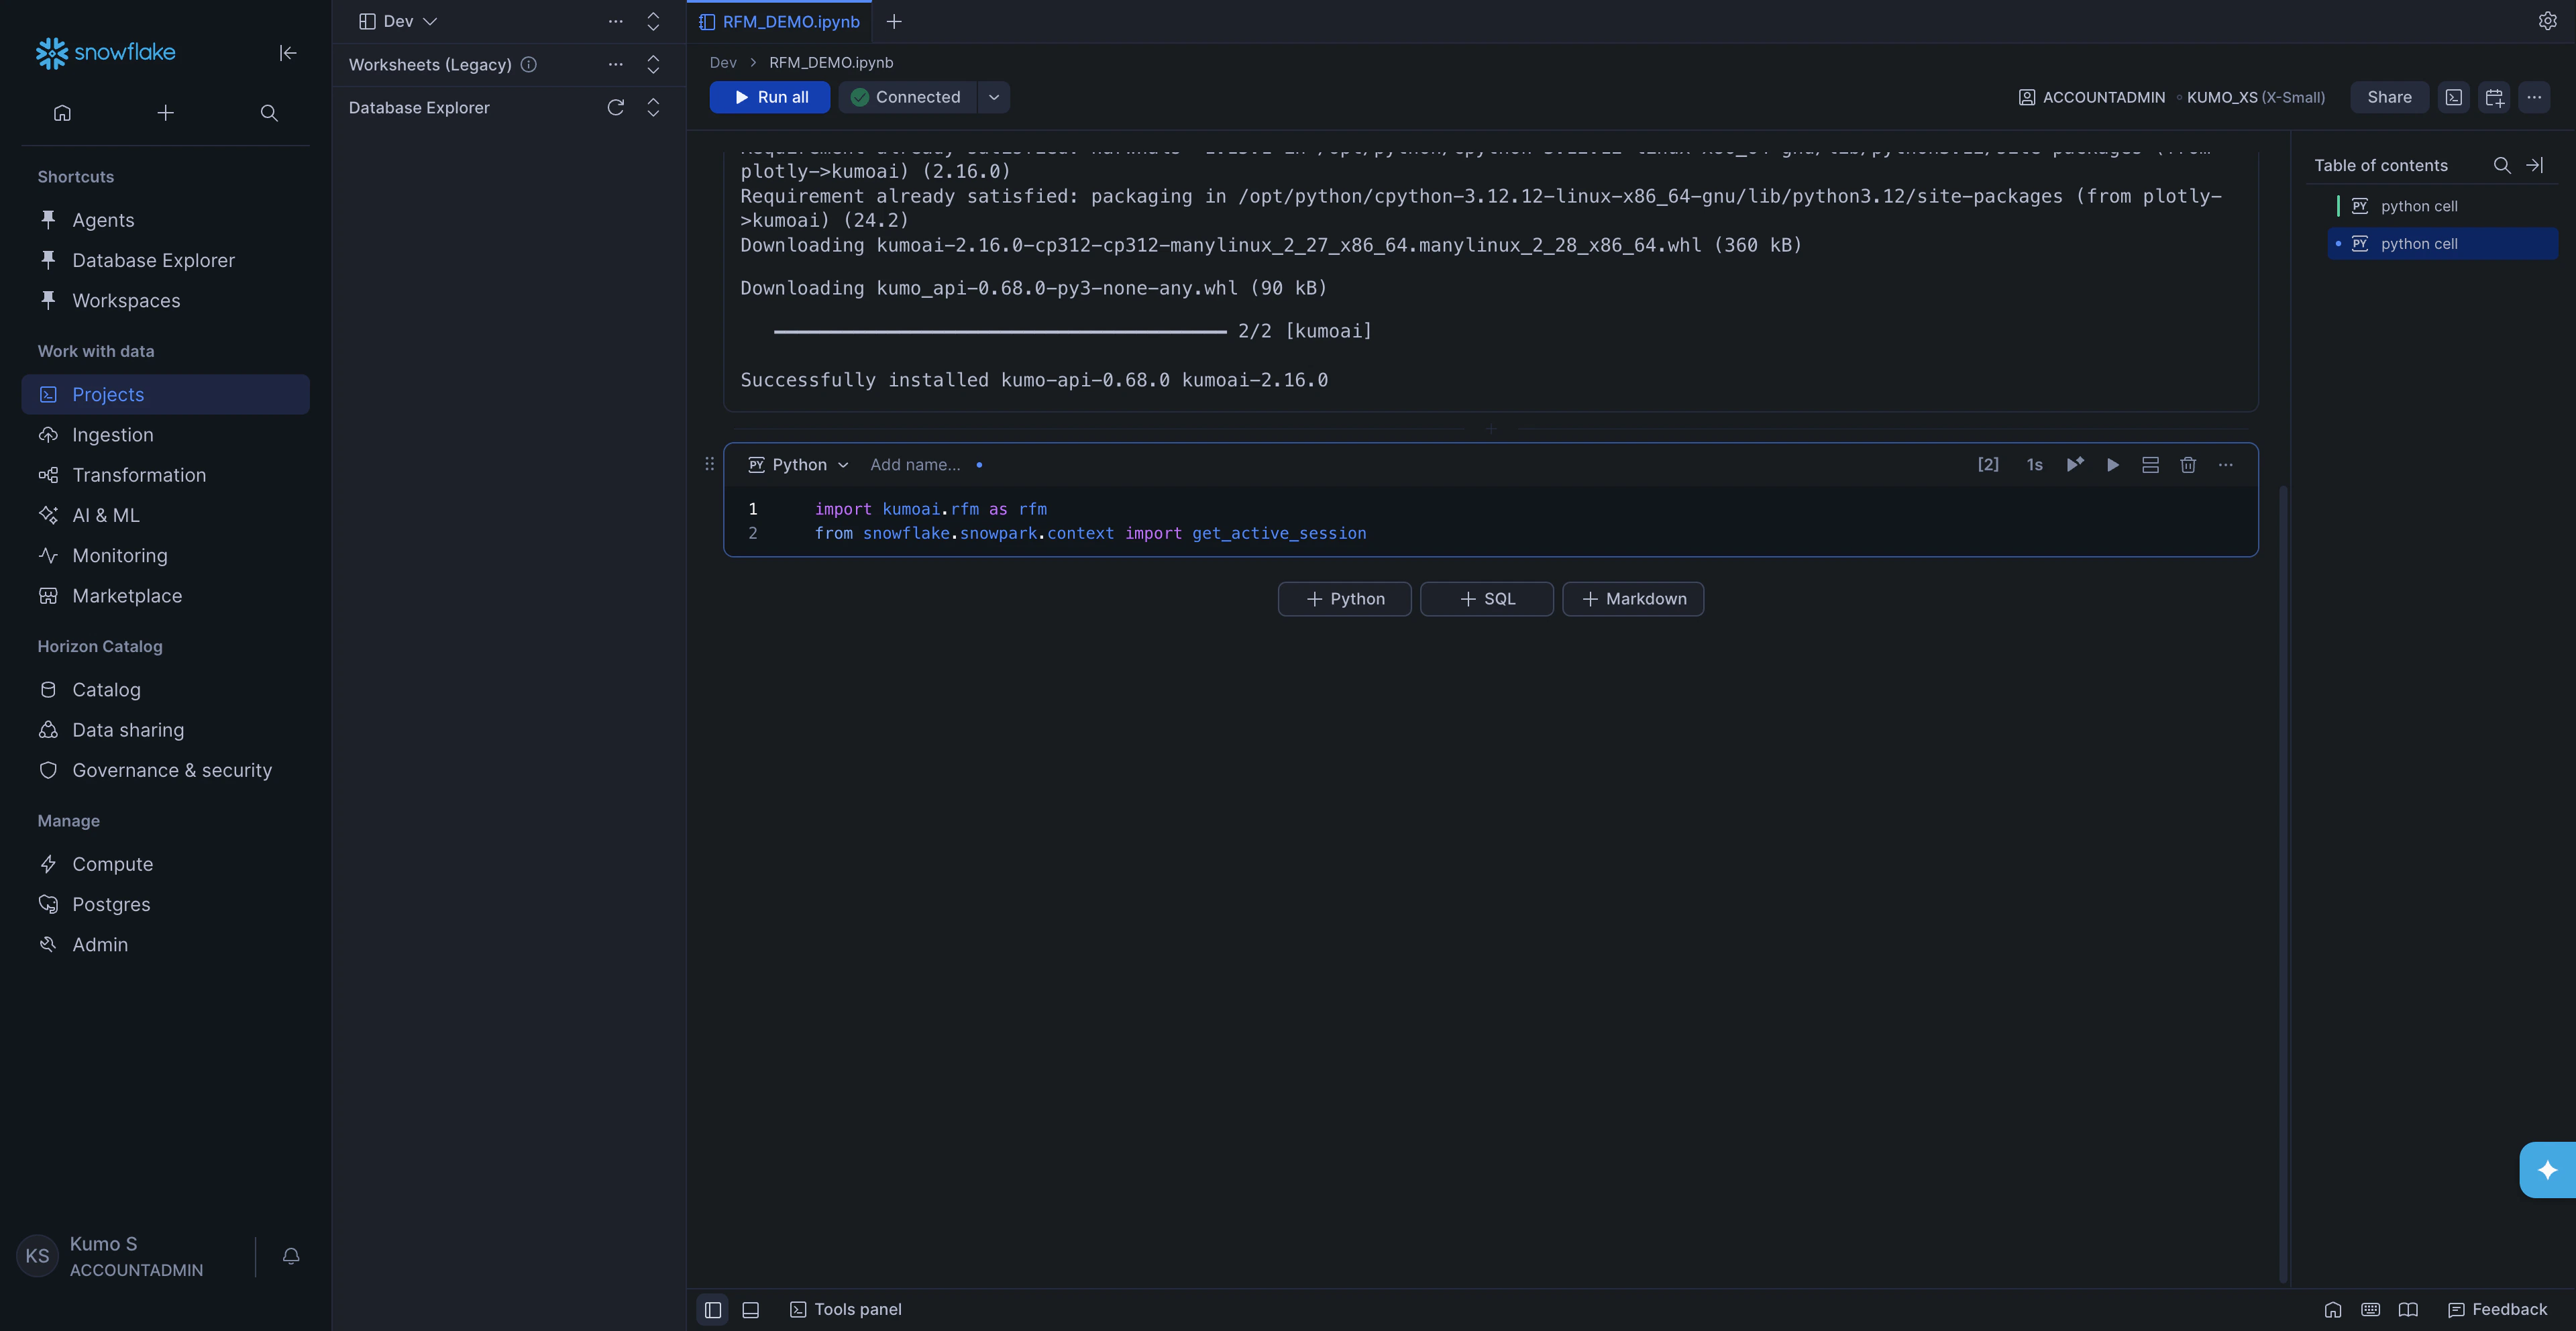
Build Your Graph and Make Predictions
A graph is a description of your data. It defines:- Your tables and their columns
- The primary and foreign key relationships between tables
- Semantic definitions on fields, such as whether a column is categorical
- Option A - From pandas DataFrames (quick testing with small datasets; the data must fit in notebook memory)
- Option B - From a Snowflake Semantic View (recommended for production; scales to any data size and captures rich semantic definitions)
- Option C - From Snowflake tables with manual table selection (no semantic view required; scales to any data size)
Option A loads your tables into pandas DataFrames inside the notebook, so the notebook’s compute pool needs enough memory to hold the data. For large datasets, use Option B or Option C instead, which read data directly from Snowflake without loading it into memory.
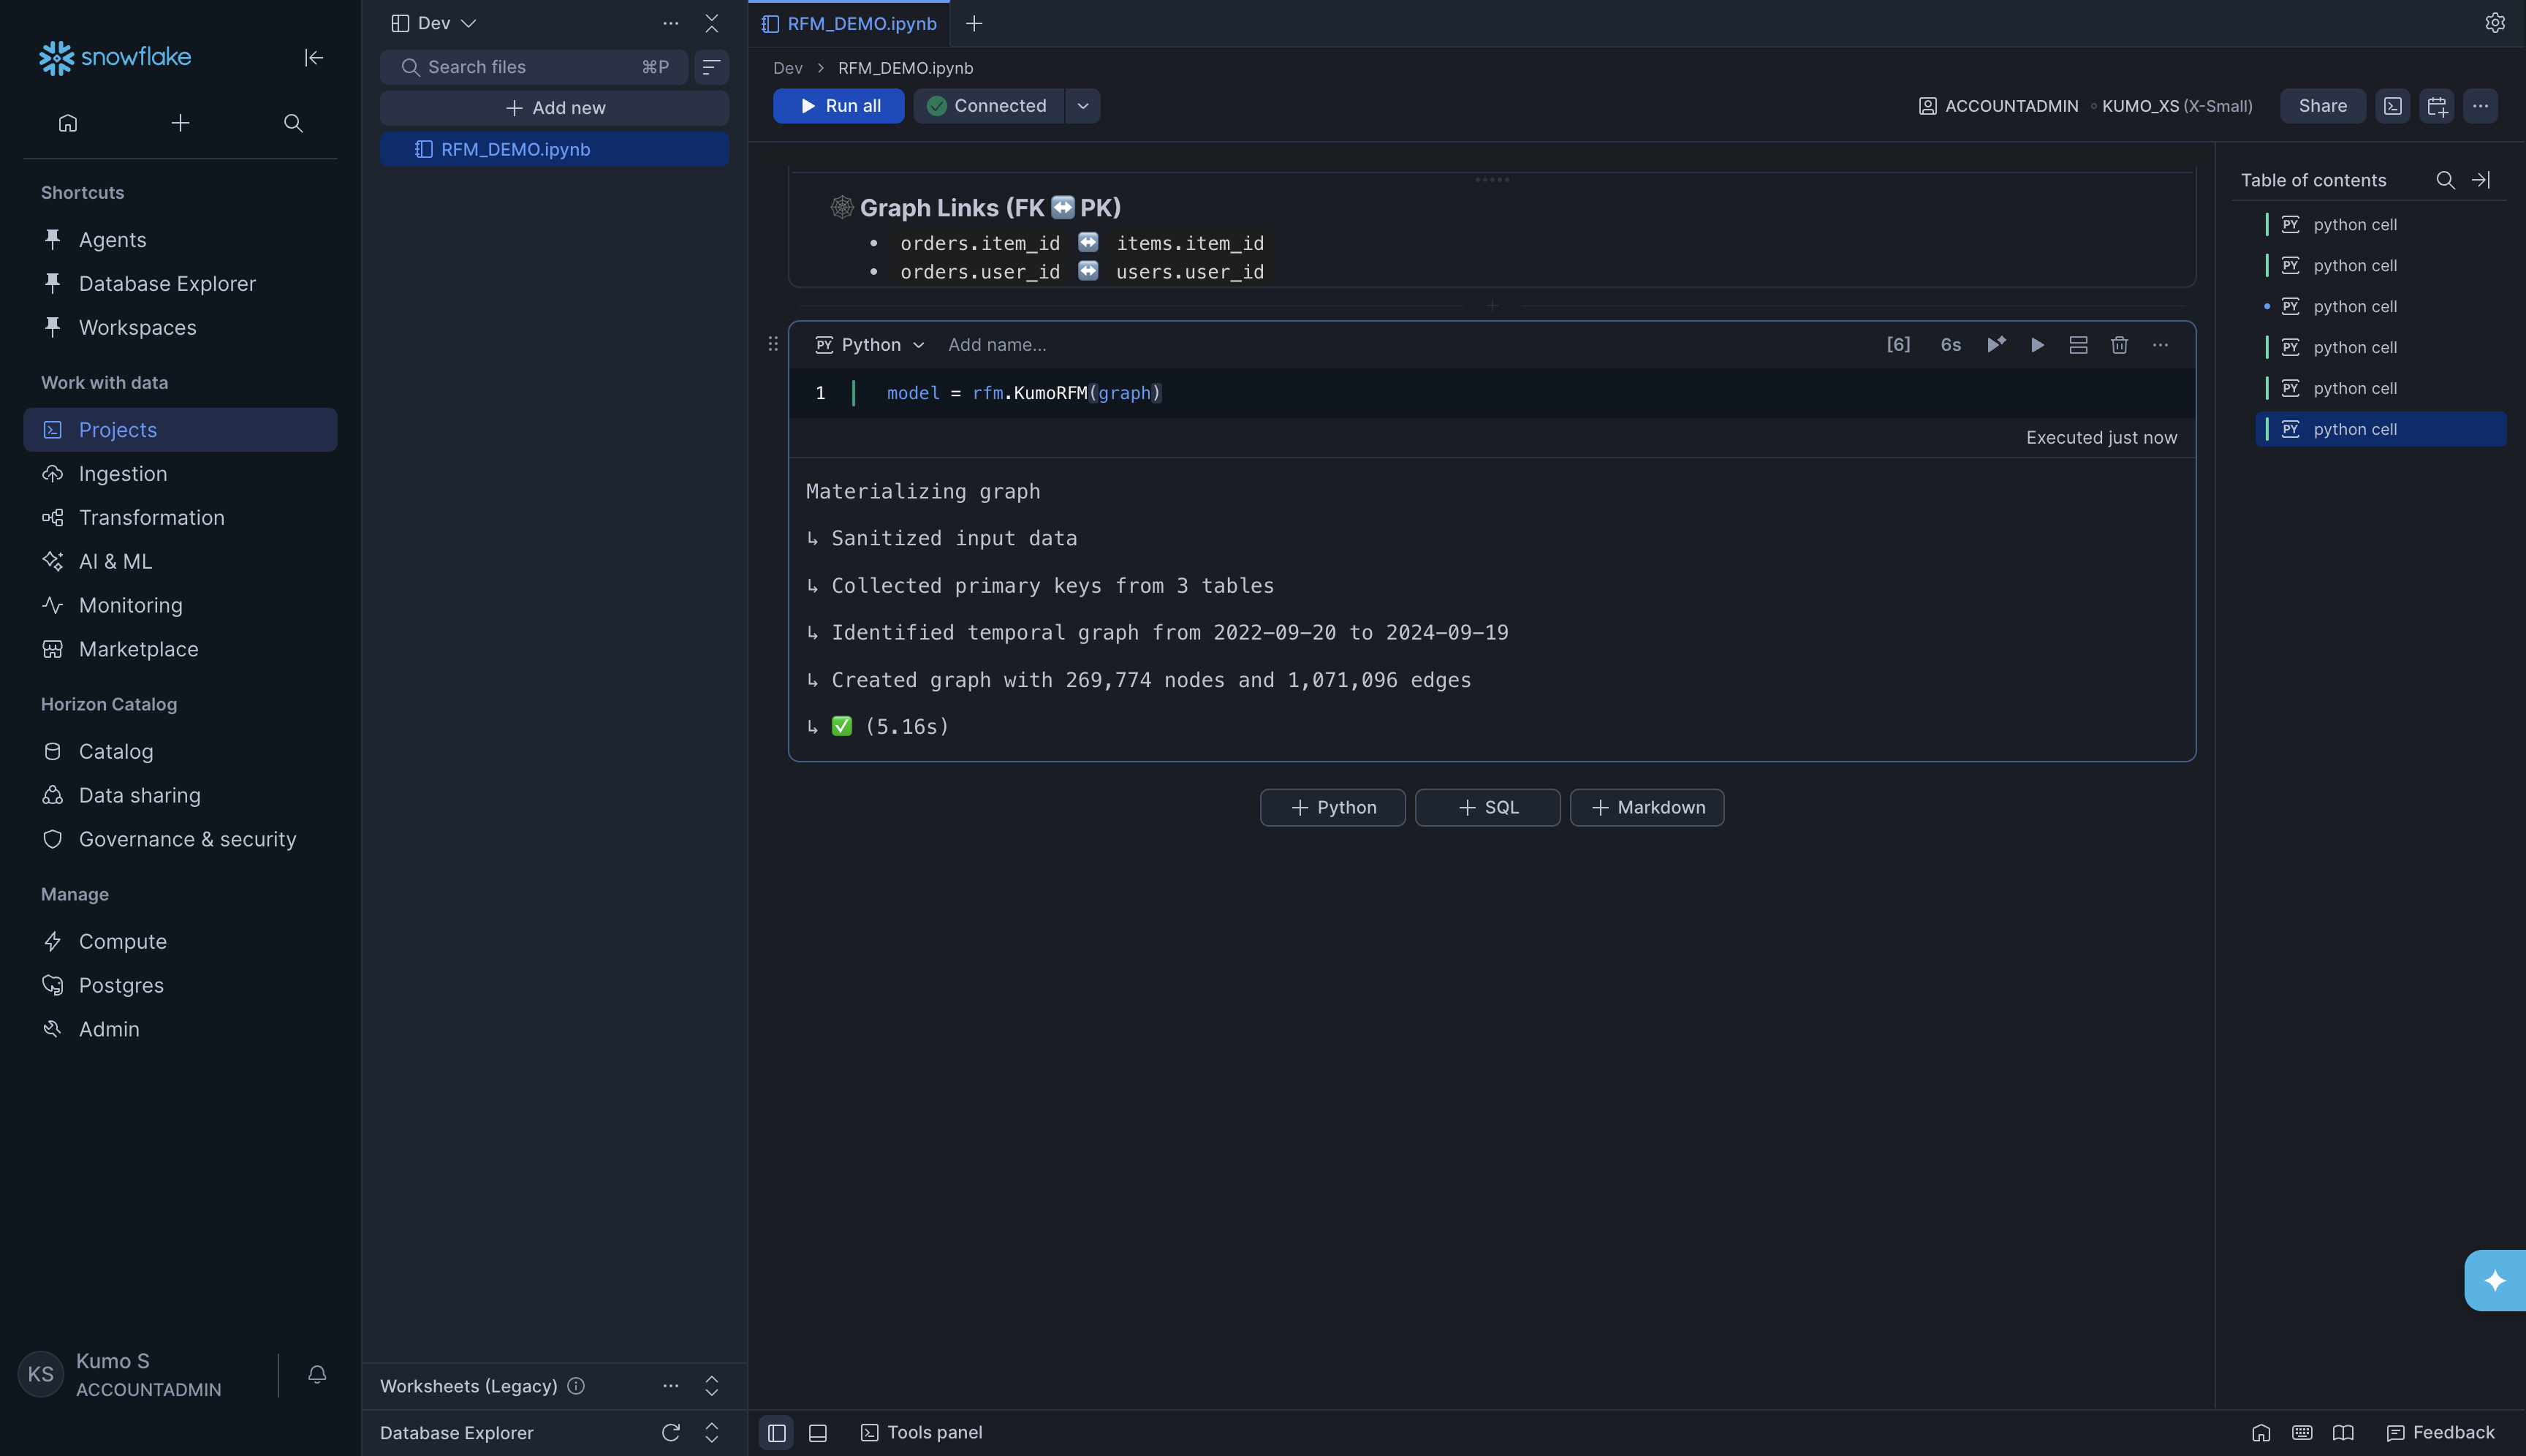
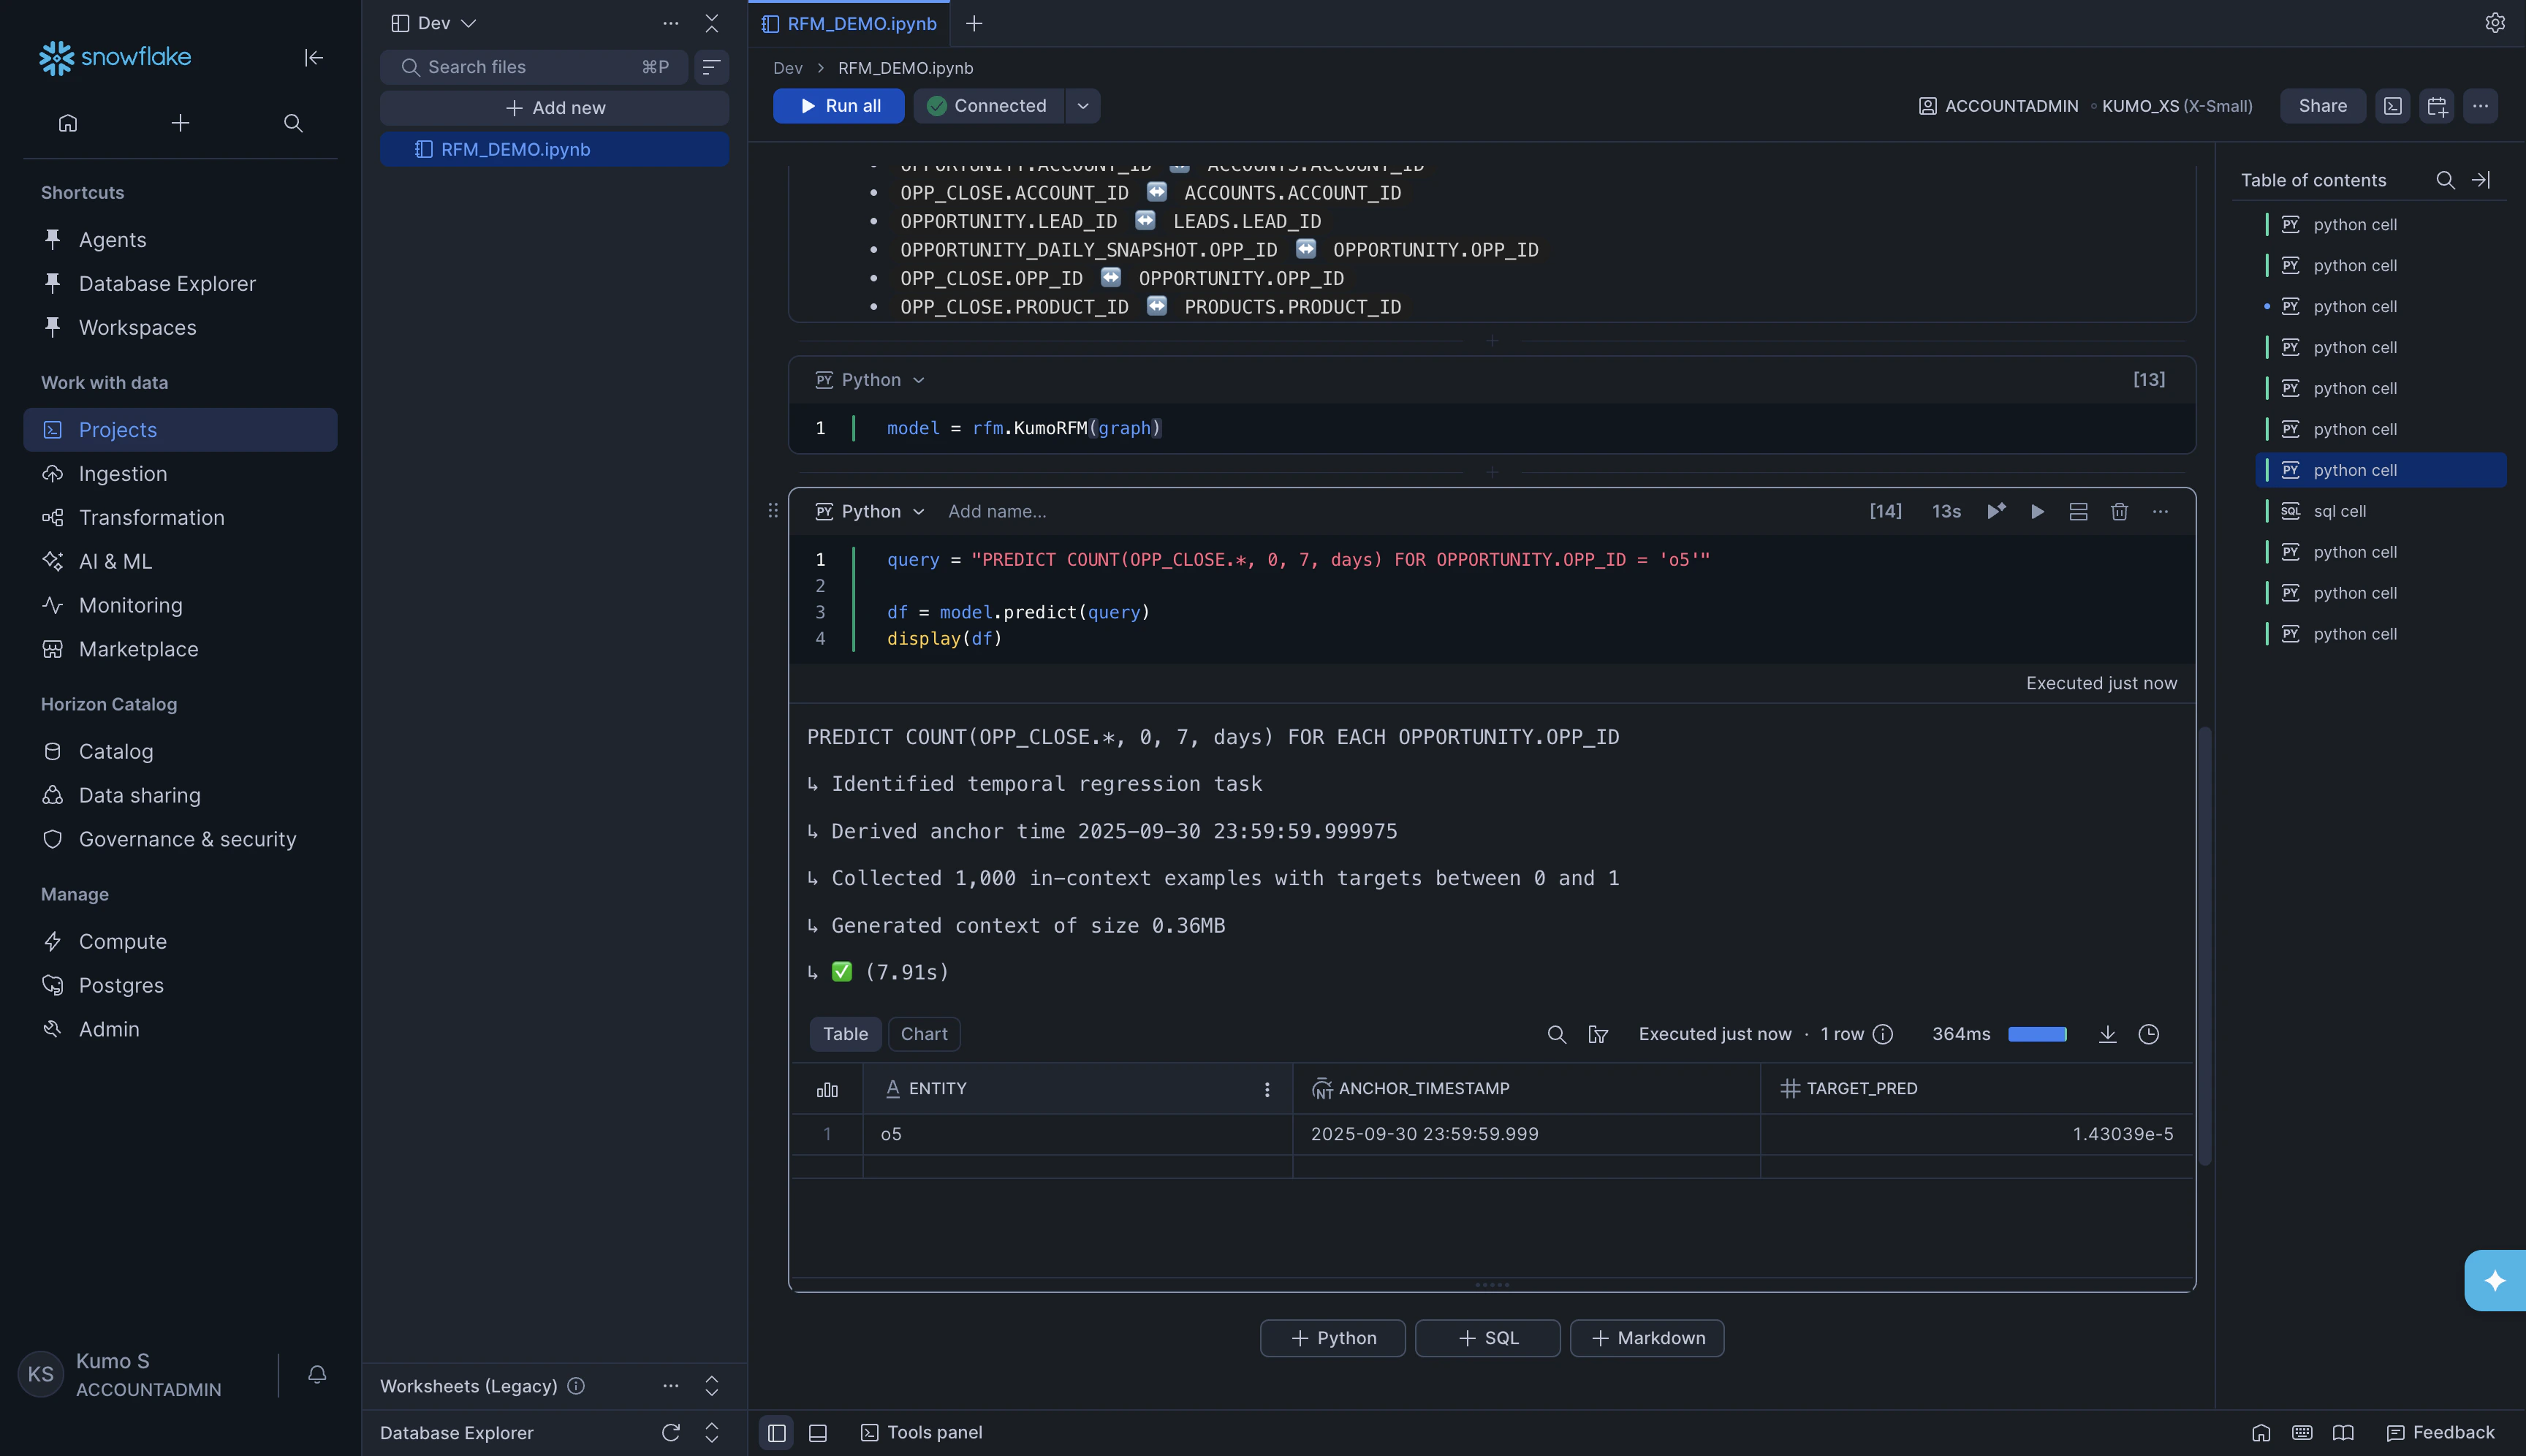
rfm.KumoRFM(graph) and run predictions with model.predict(query).
Option A: From pandas DataFrames (LocalGraph)
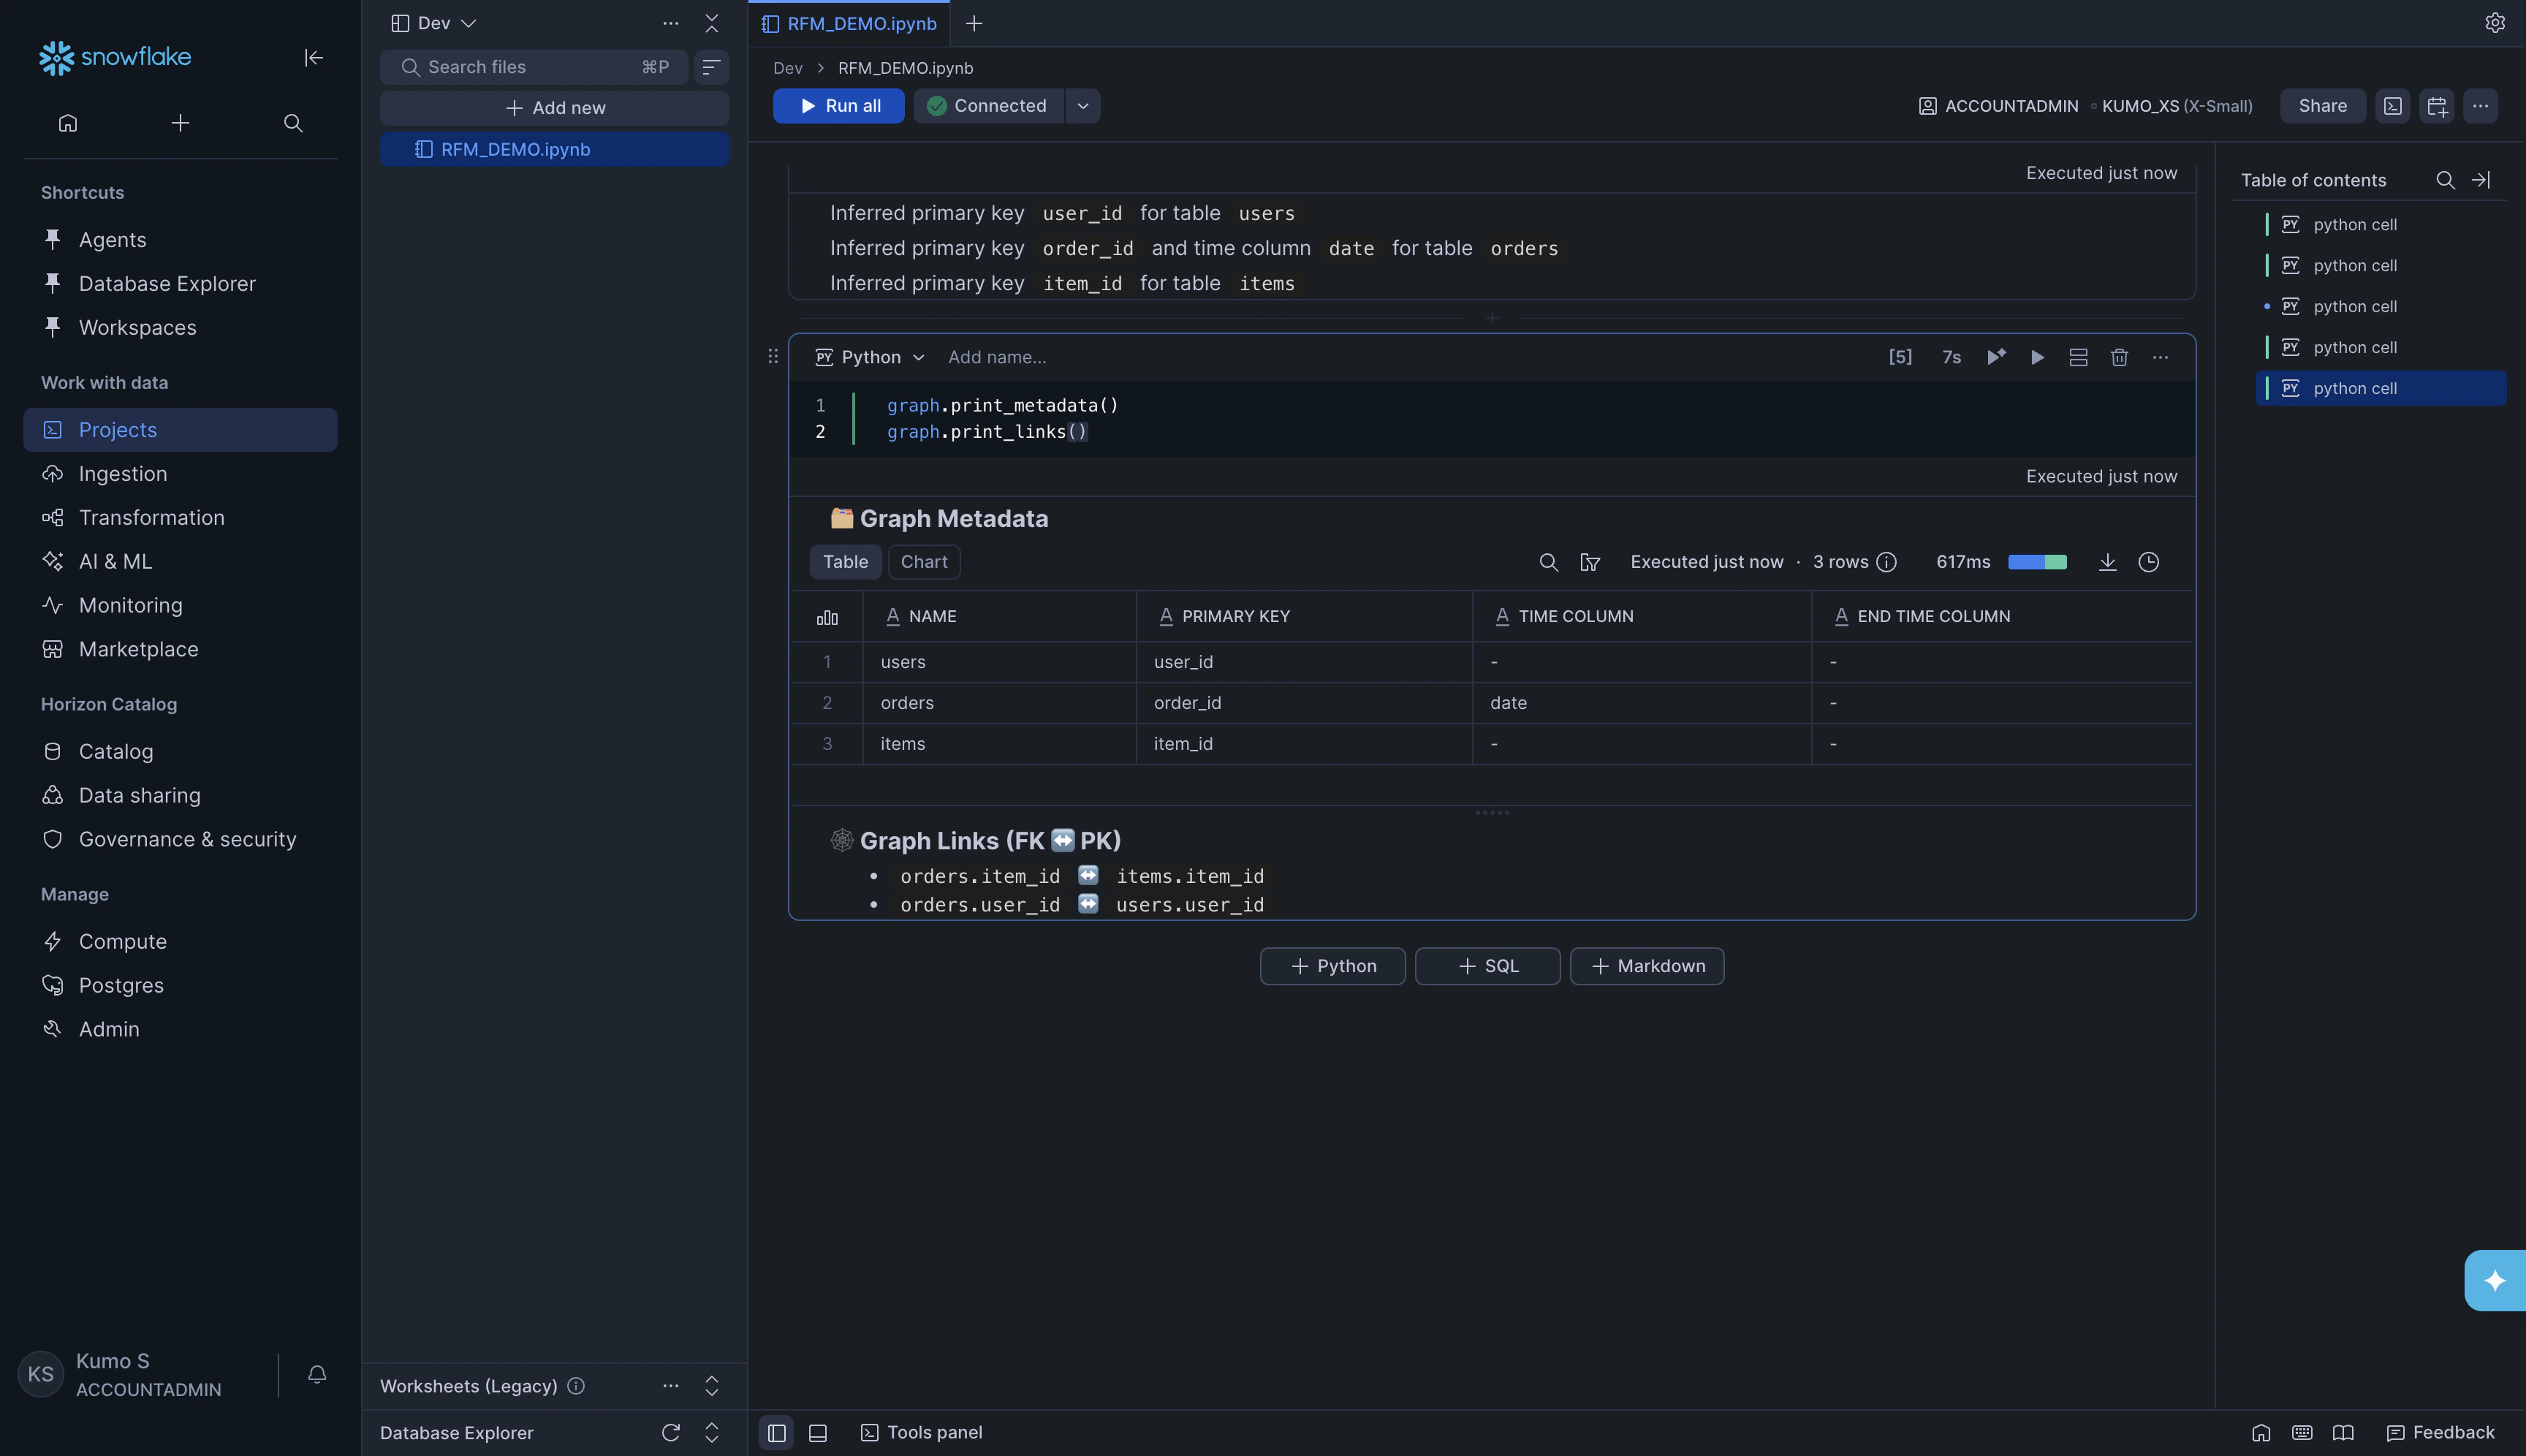
This is the easiest way to get started. You load data into pandas DataFrames (from S3, local files, or anywhere else) and let KumoRFM build a graph from them. Load the data and create tables: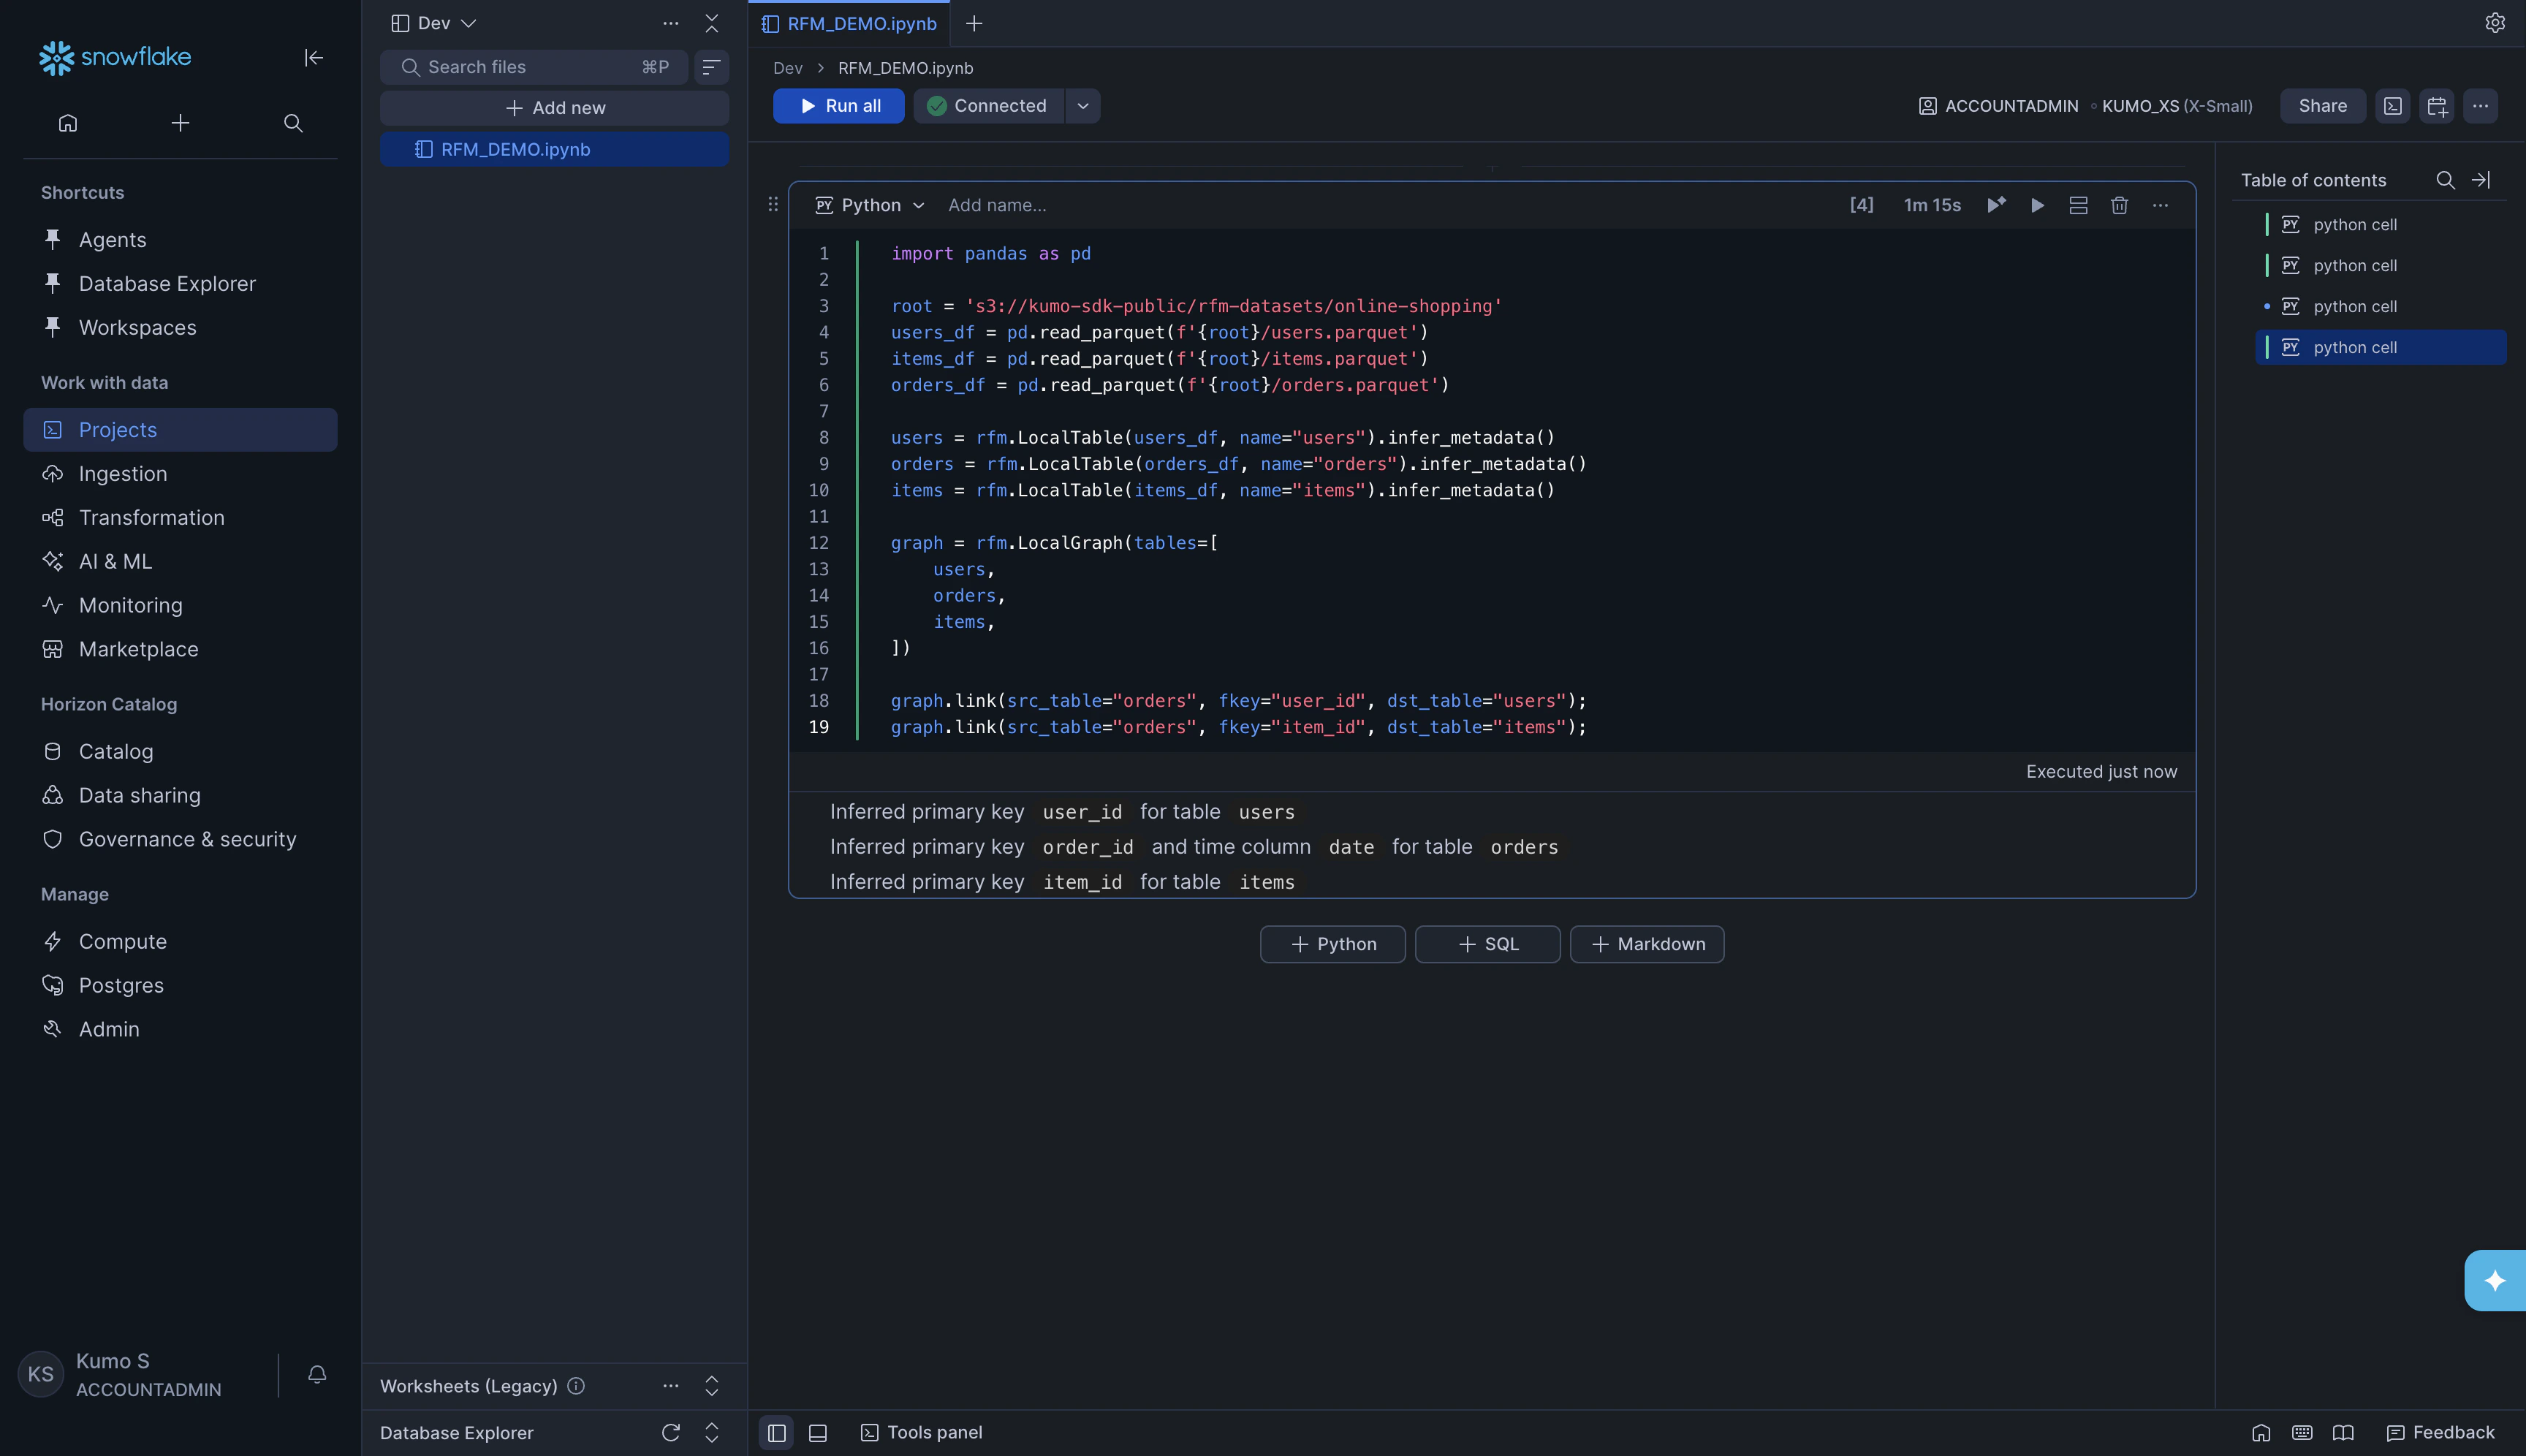
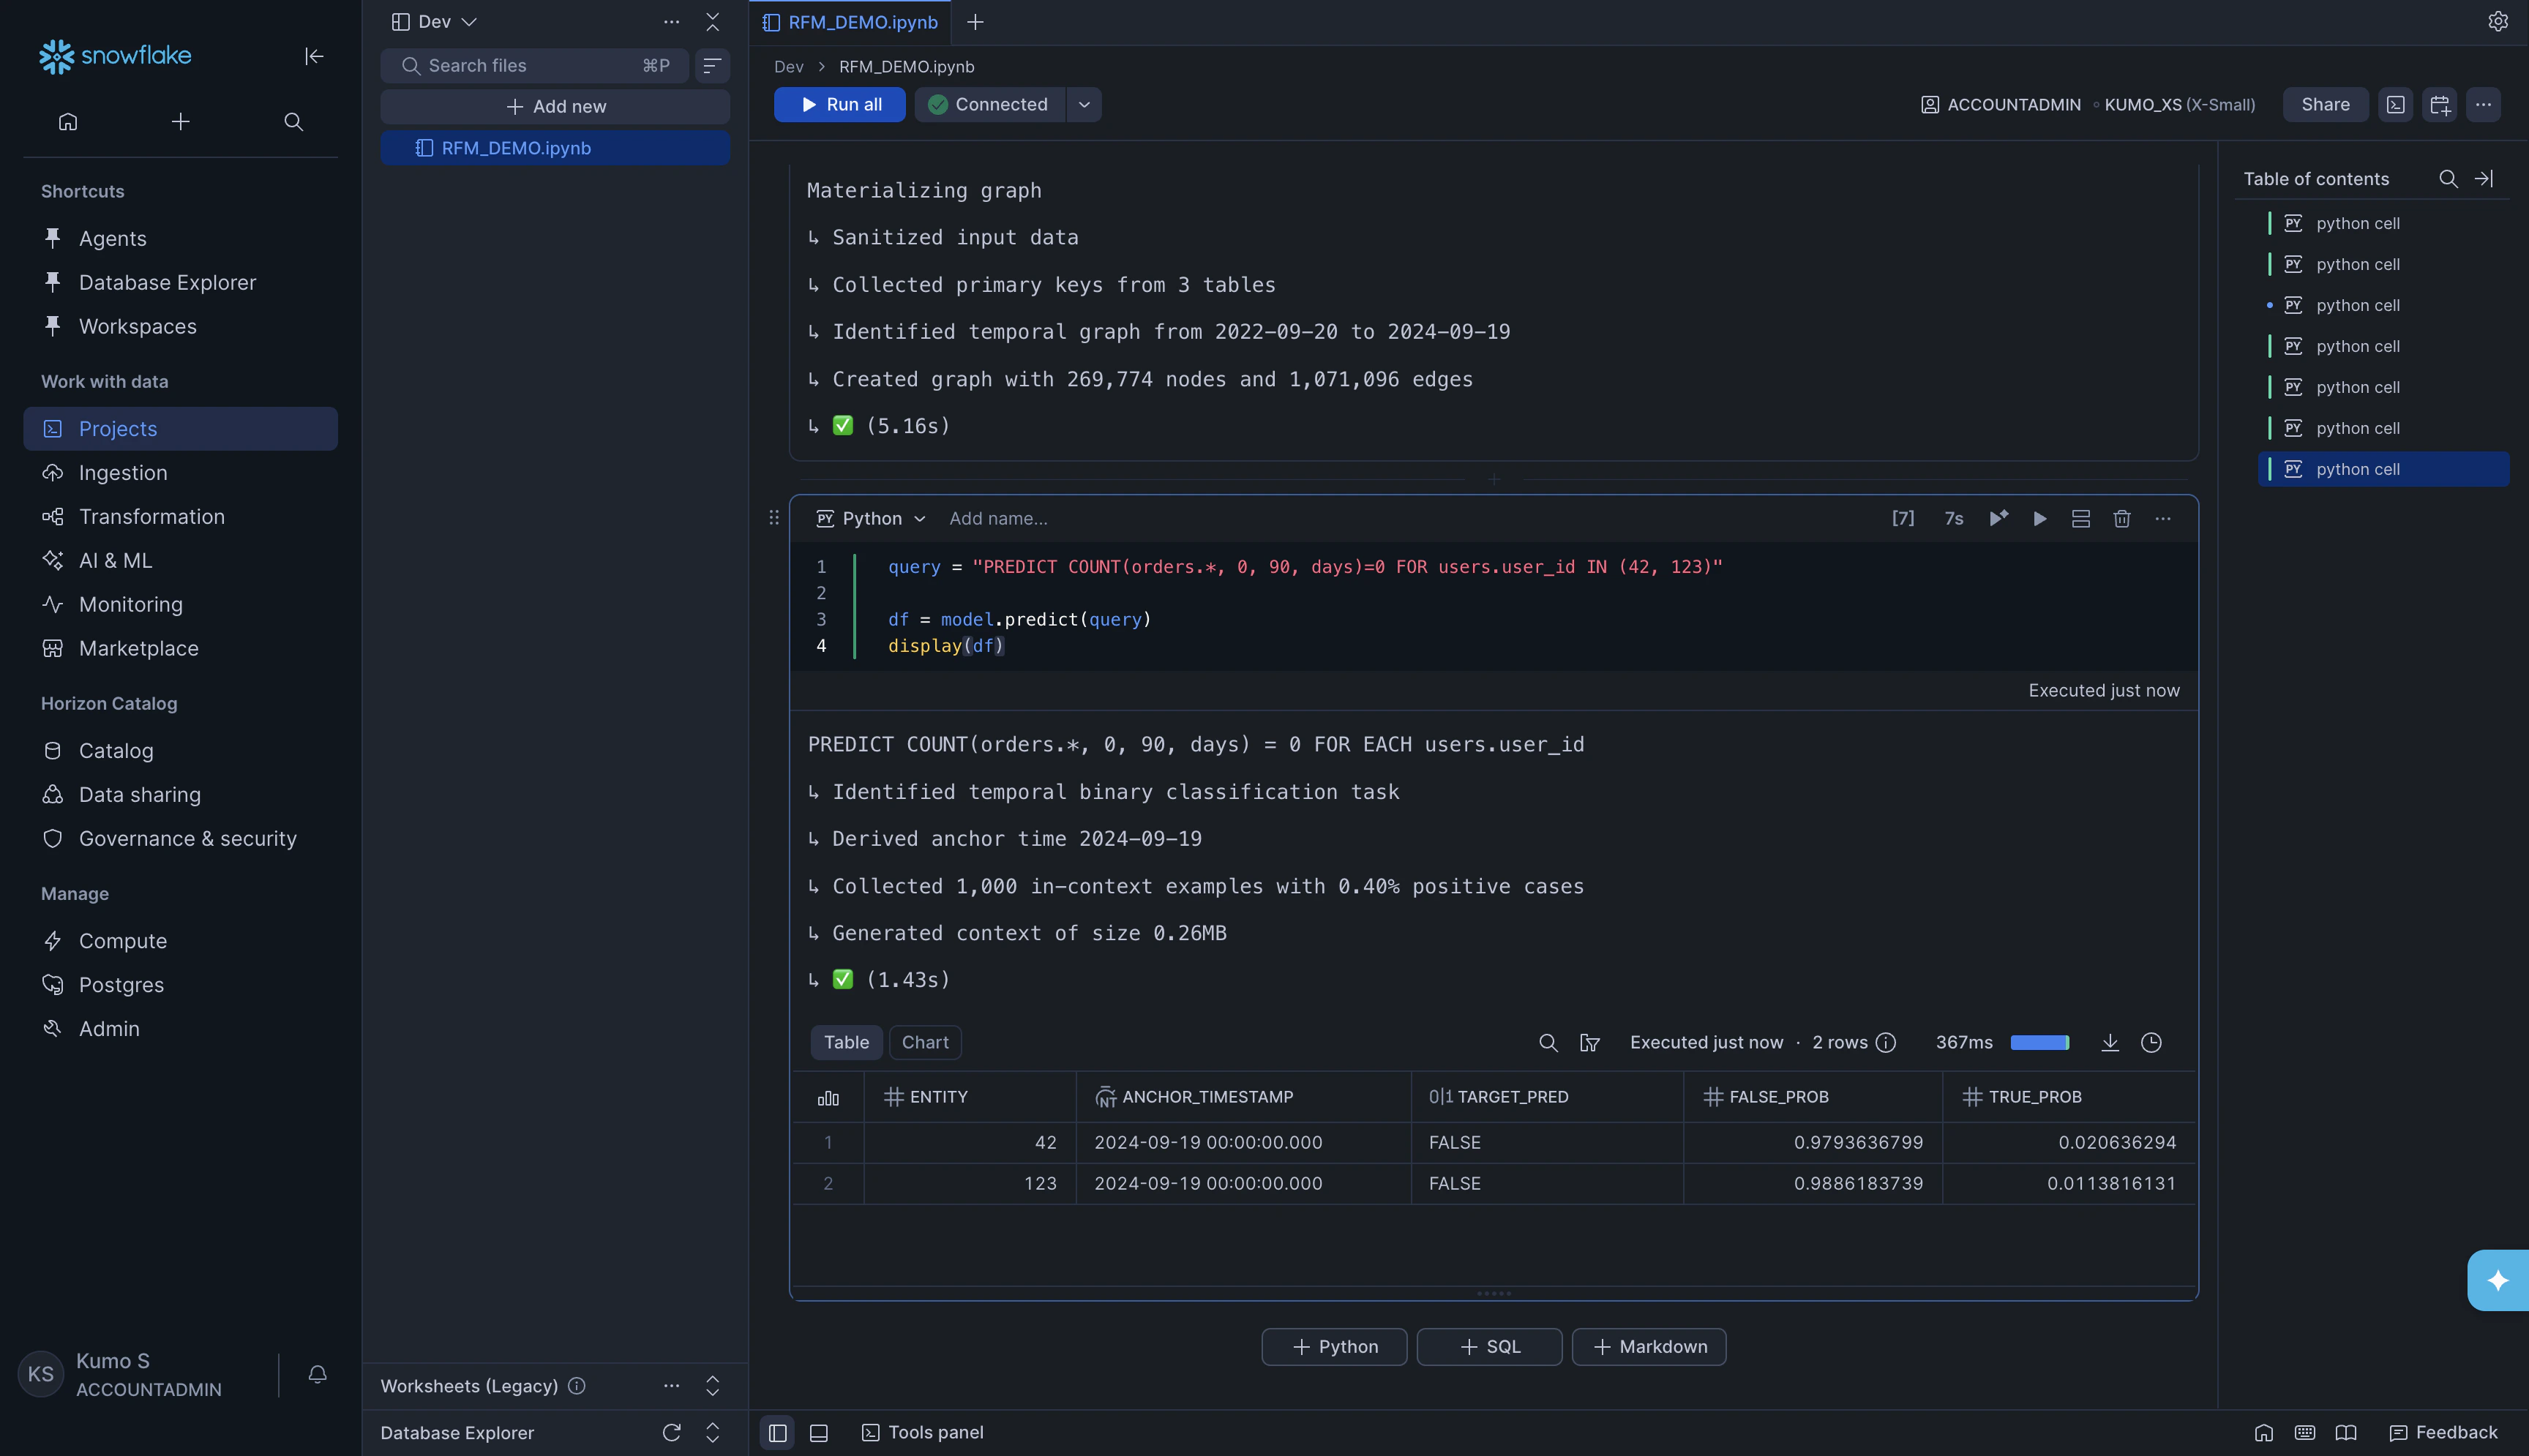
- ENTITY - The user you predicted for
- ANCHOR_TIMESTAMP - The point in time the prediction is made from
- TARGET_PRED - The predicted class (
TRUE= will churn,FALSE= will not churn) - FALSE_PROB / TRUE_PROB - The probability of each outcome
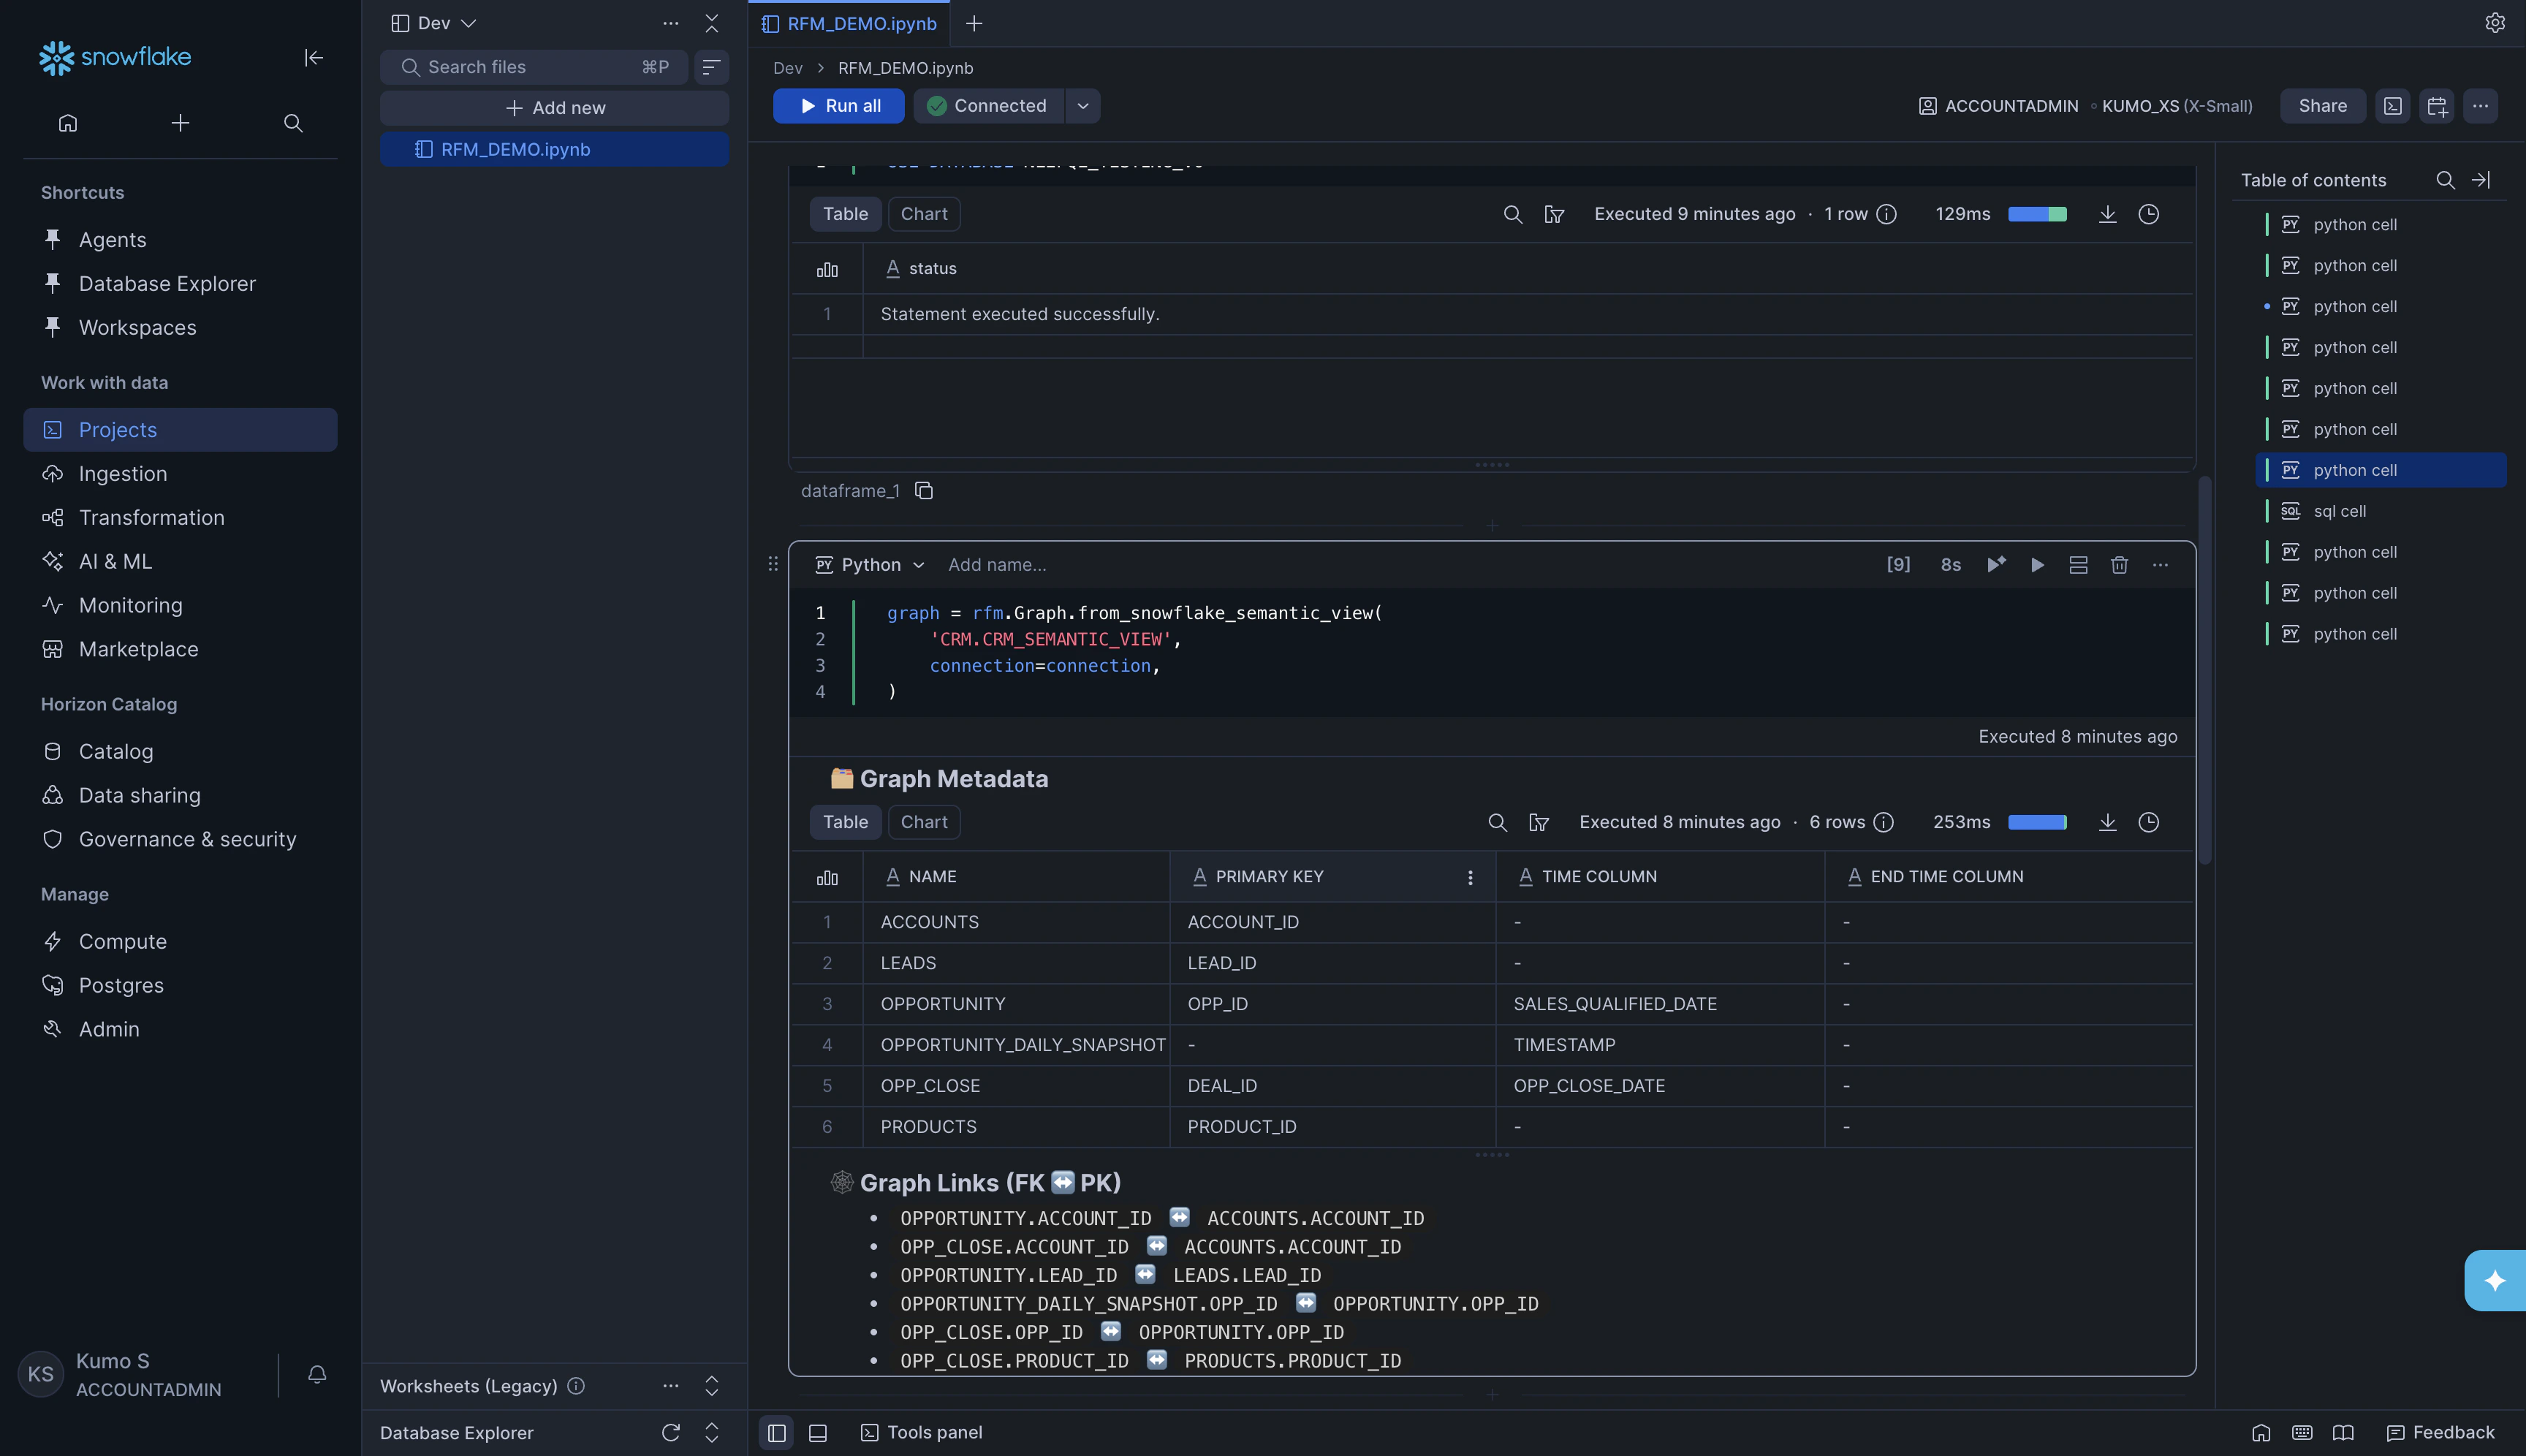
Option B: From a Snowflake Semantic View
If your organization has a Snowflake Semantic View set up, you can build a graph directly from it. The semantic view already contains table definitions and relationships, so KumoRFM reads everything automatically. Set the database (if needed). Add a SQL cell and run: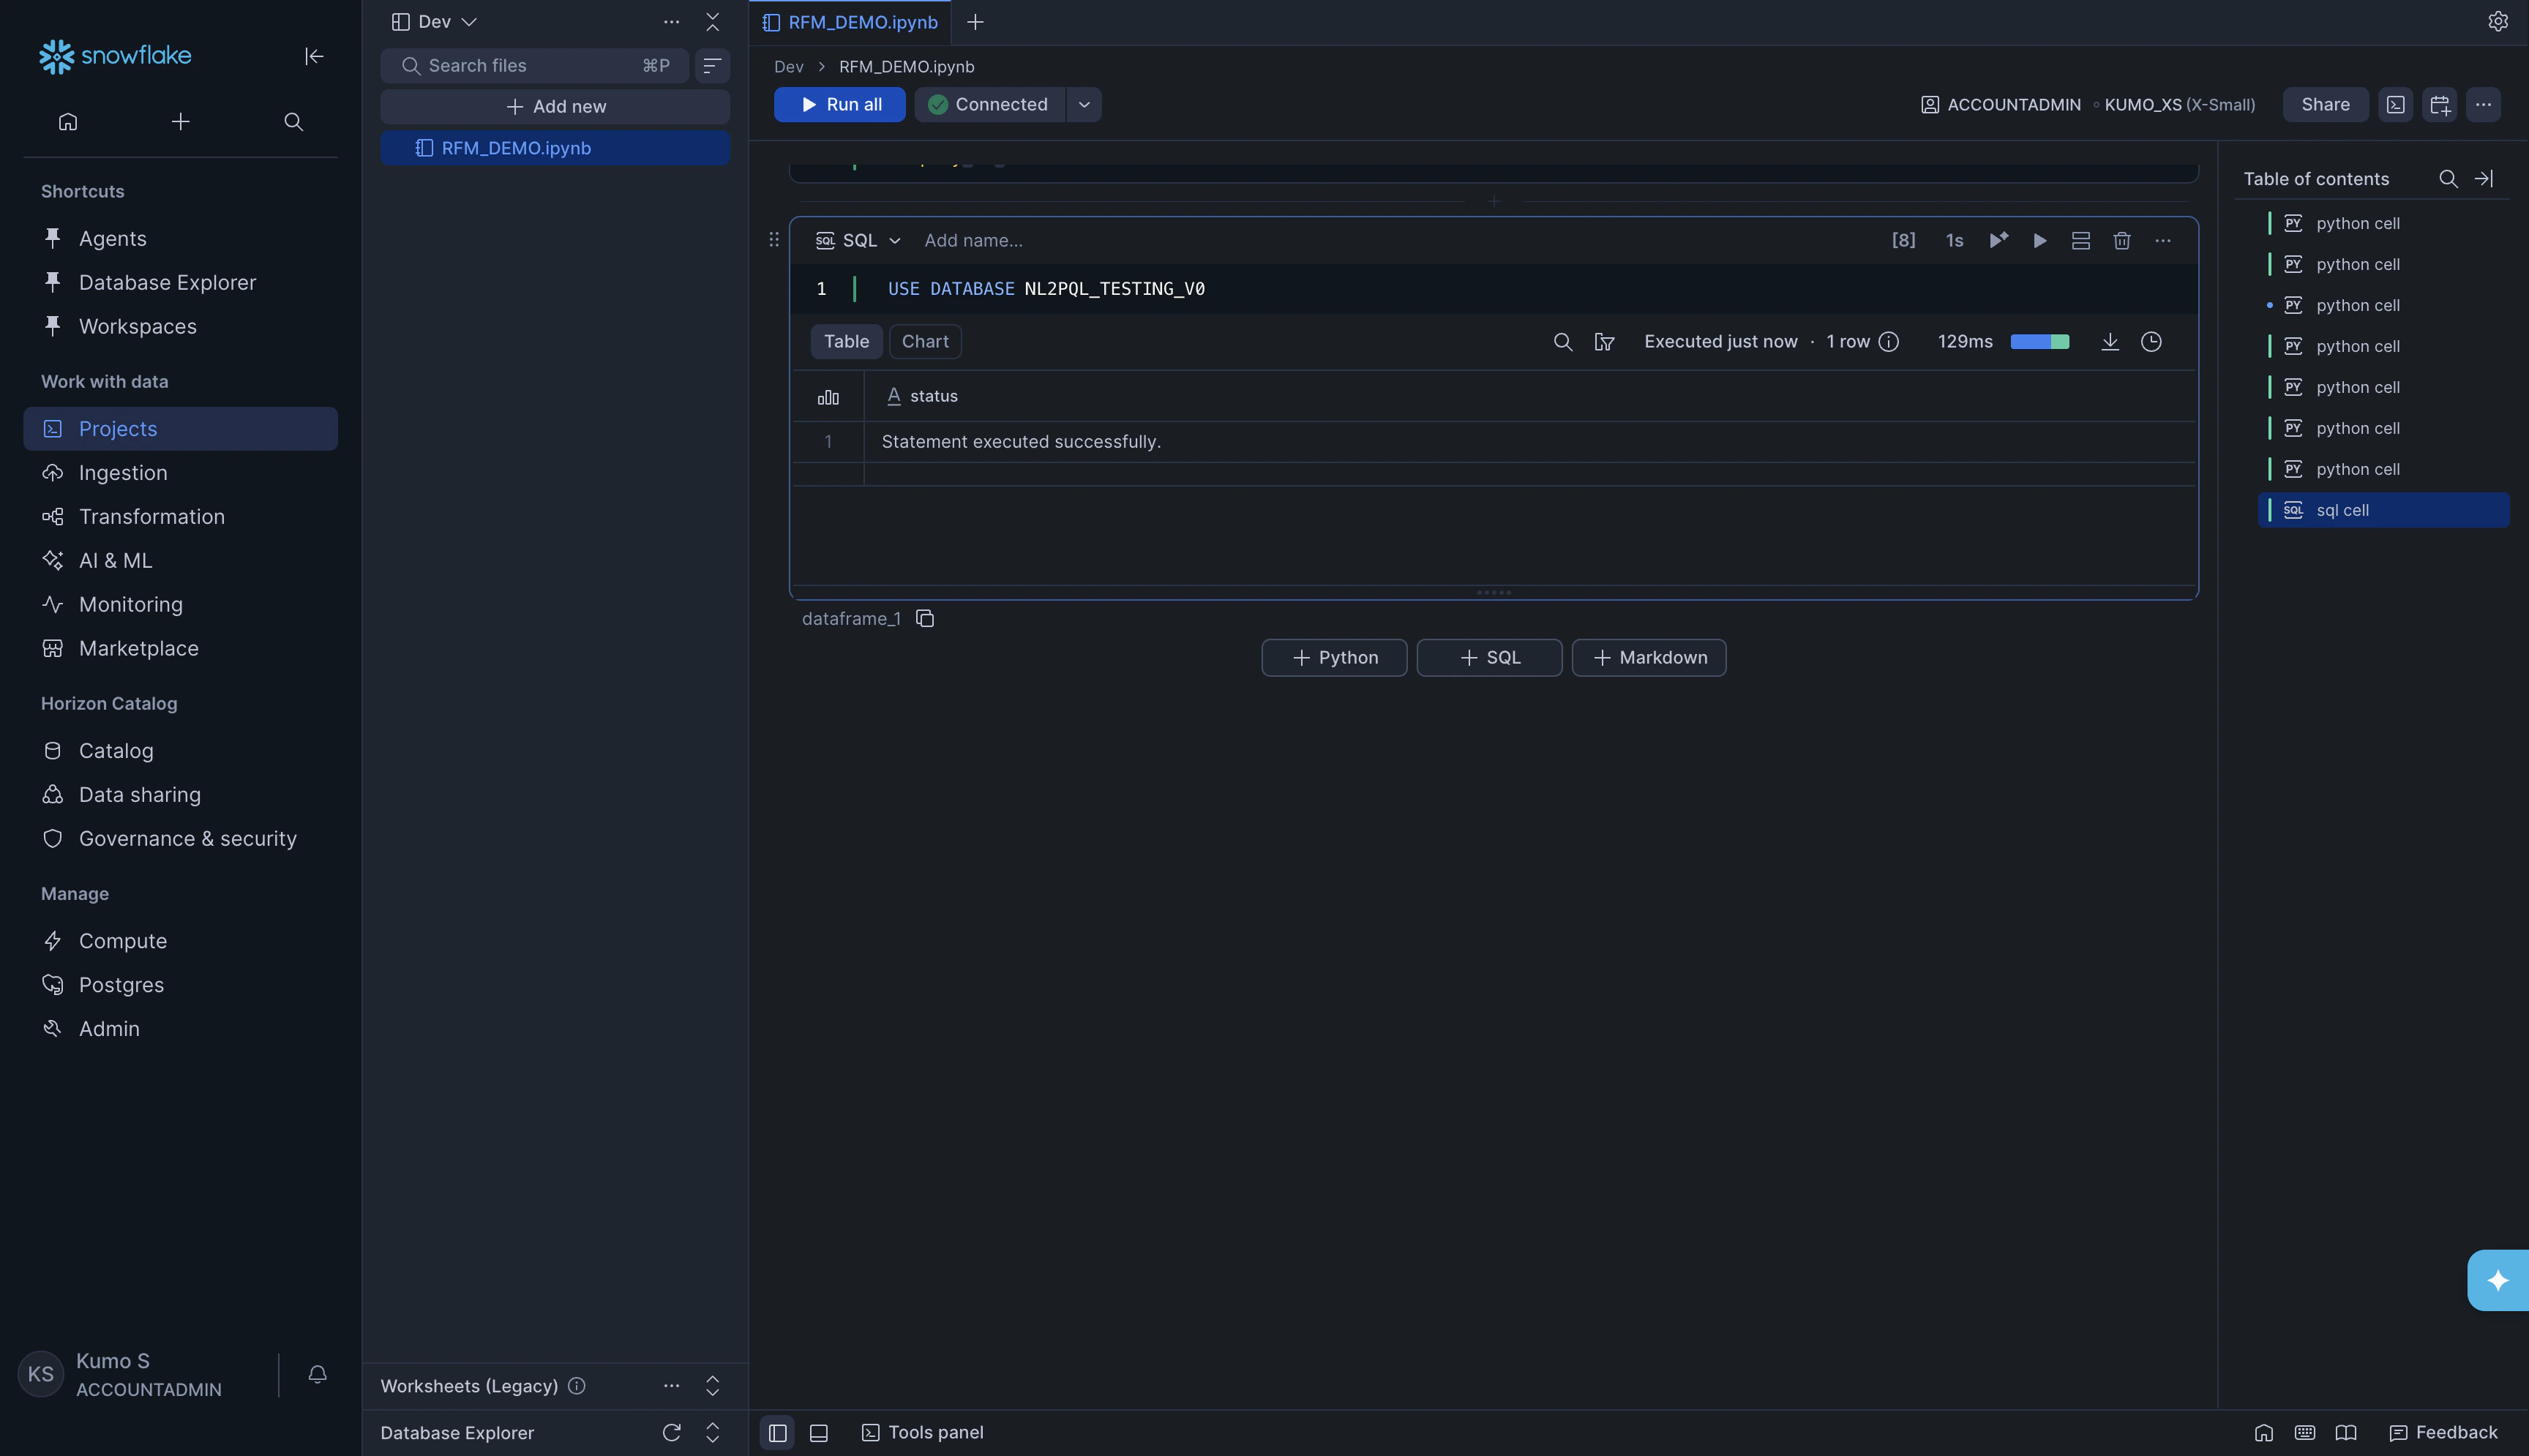
Option C: From Snowflake tables directly
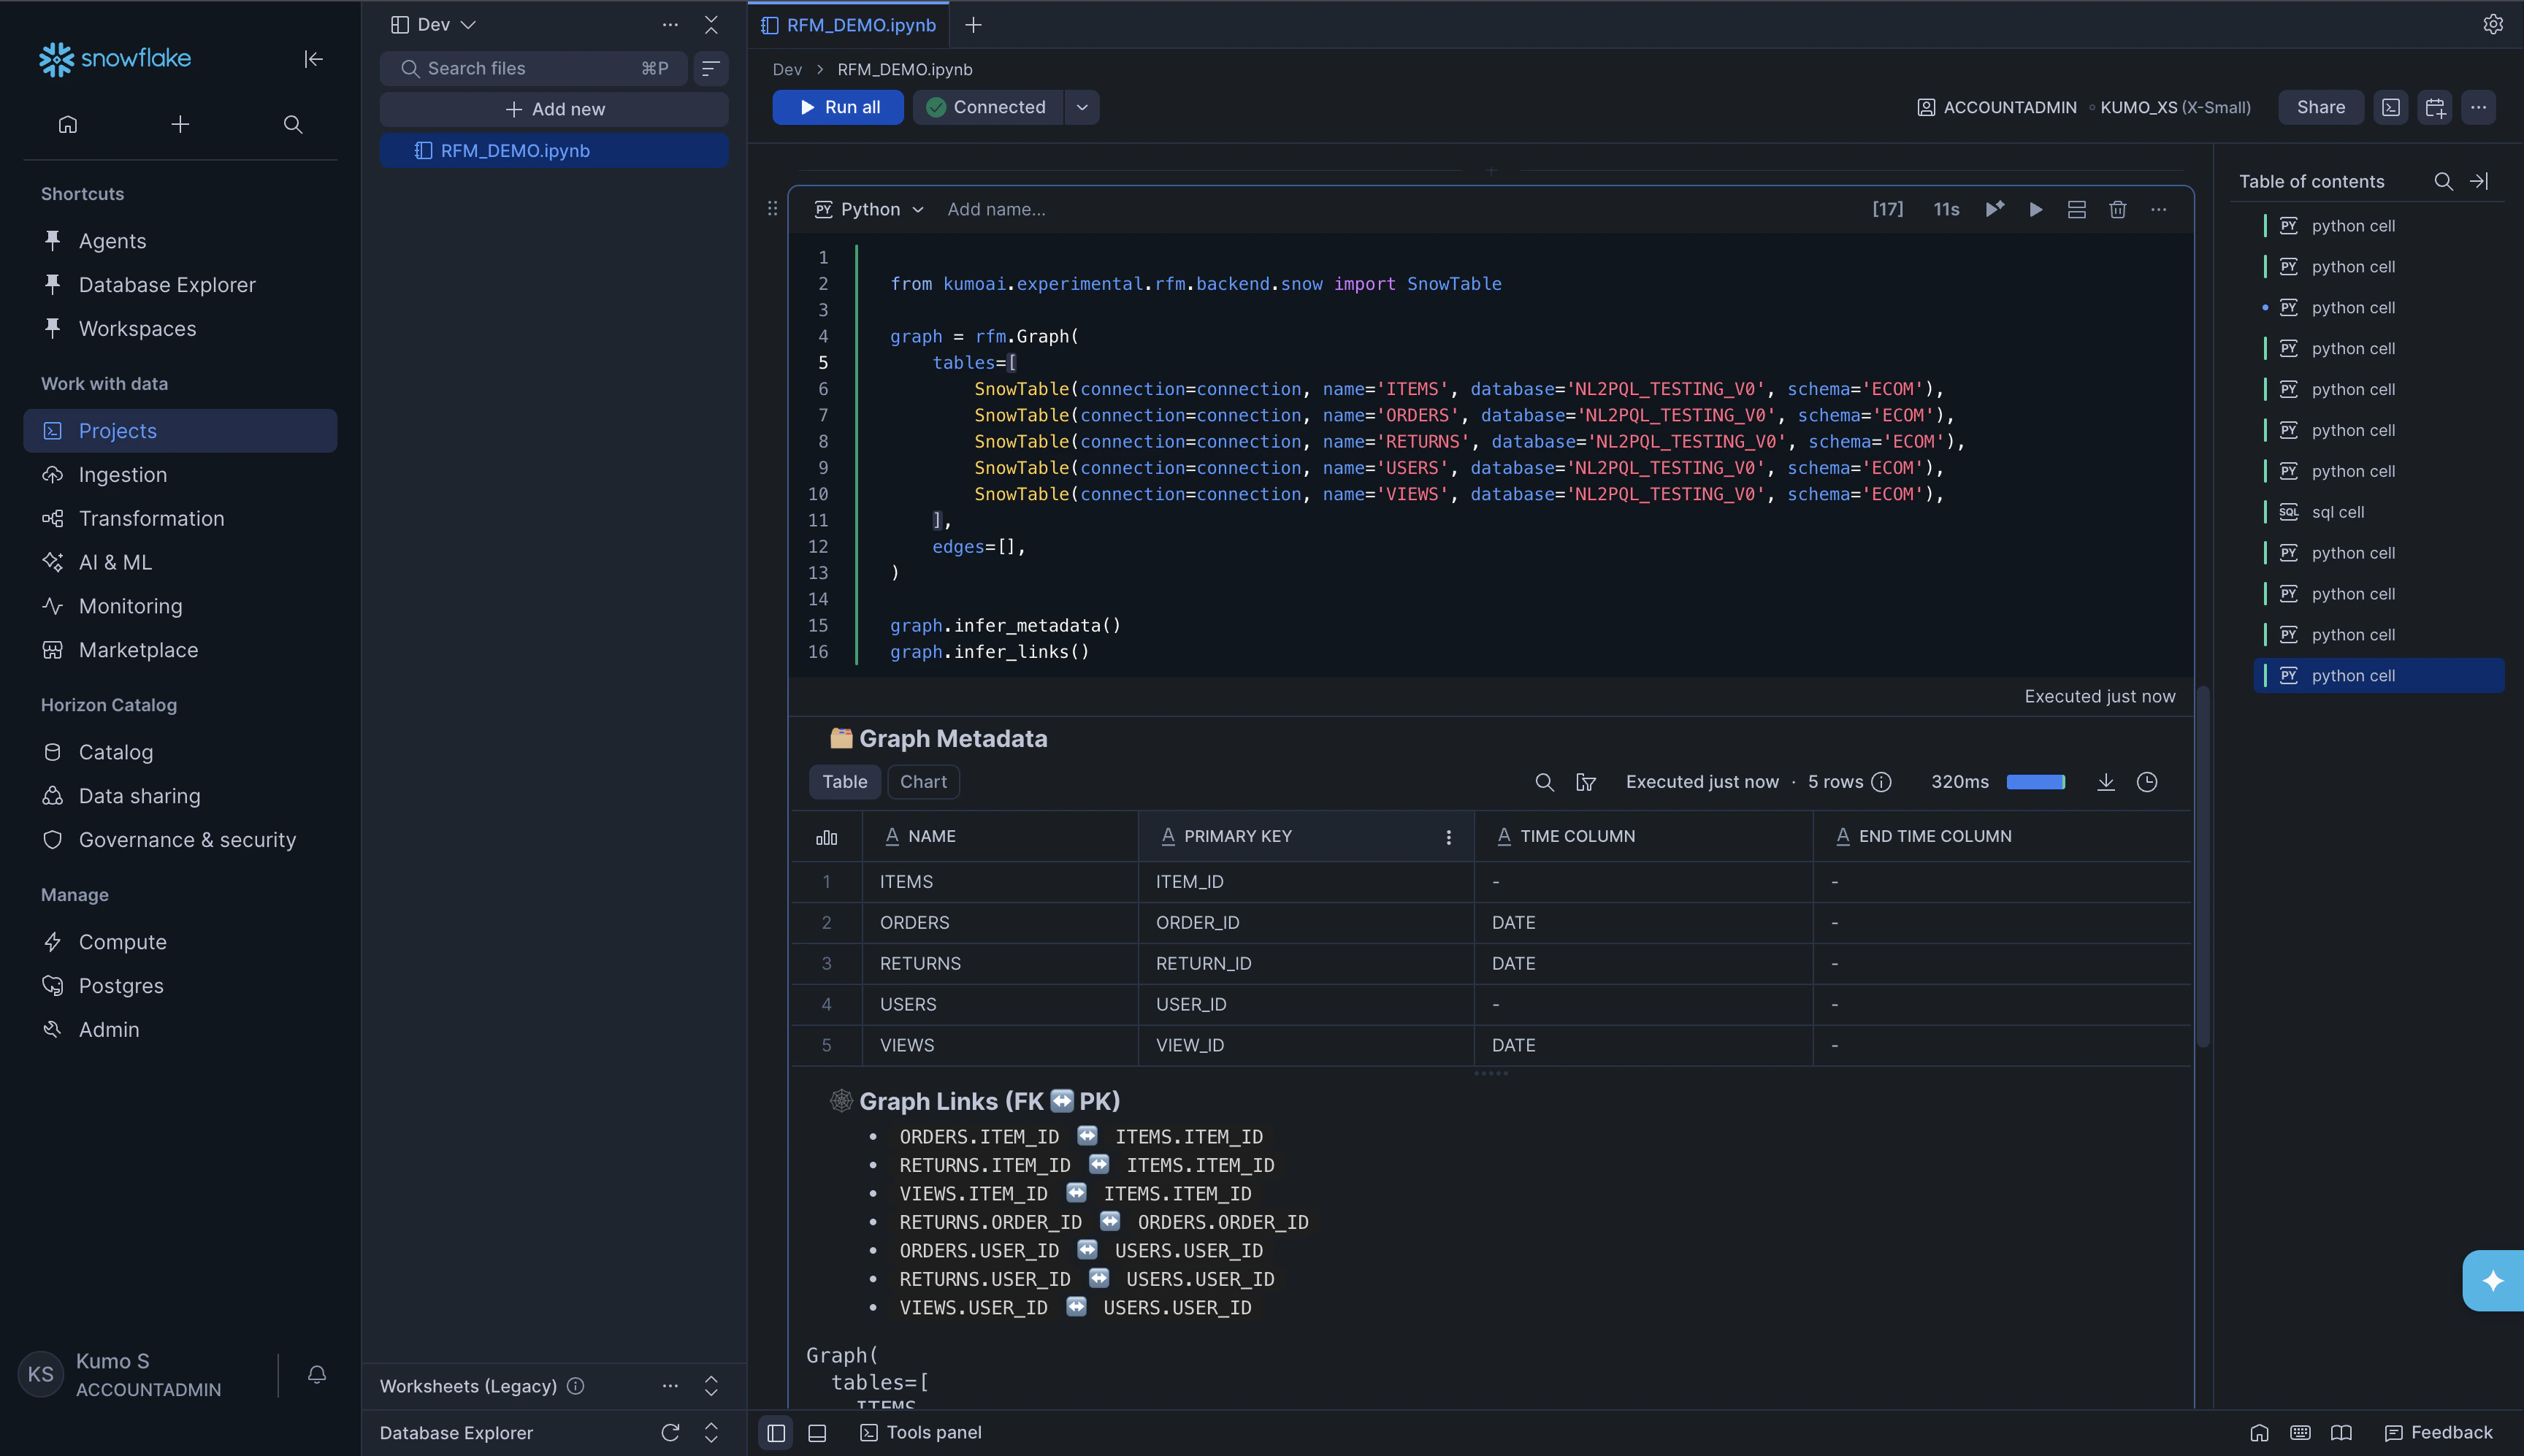
For production use, you will typically point KumoRFM at your Snowflake tables directly. You create aSnowTable for each table, then combine them into a Graph.
Build the graph from Snowflake tables:
database, schema, and table name values with your own. KumoRFM will detect primary keys, time columns, and foreign key relationships automatically.
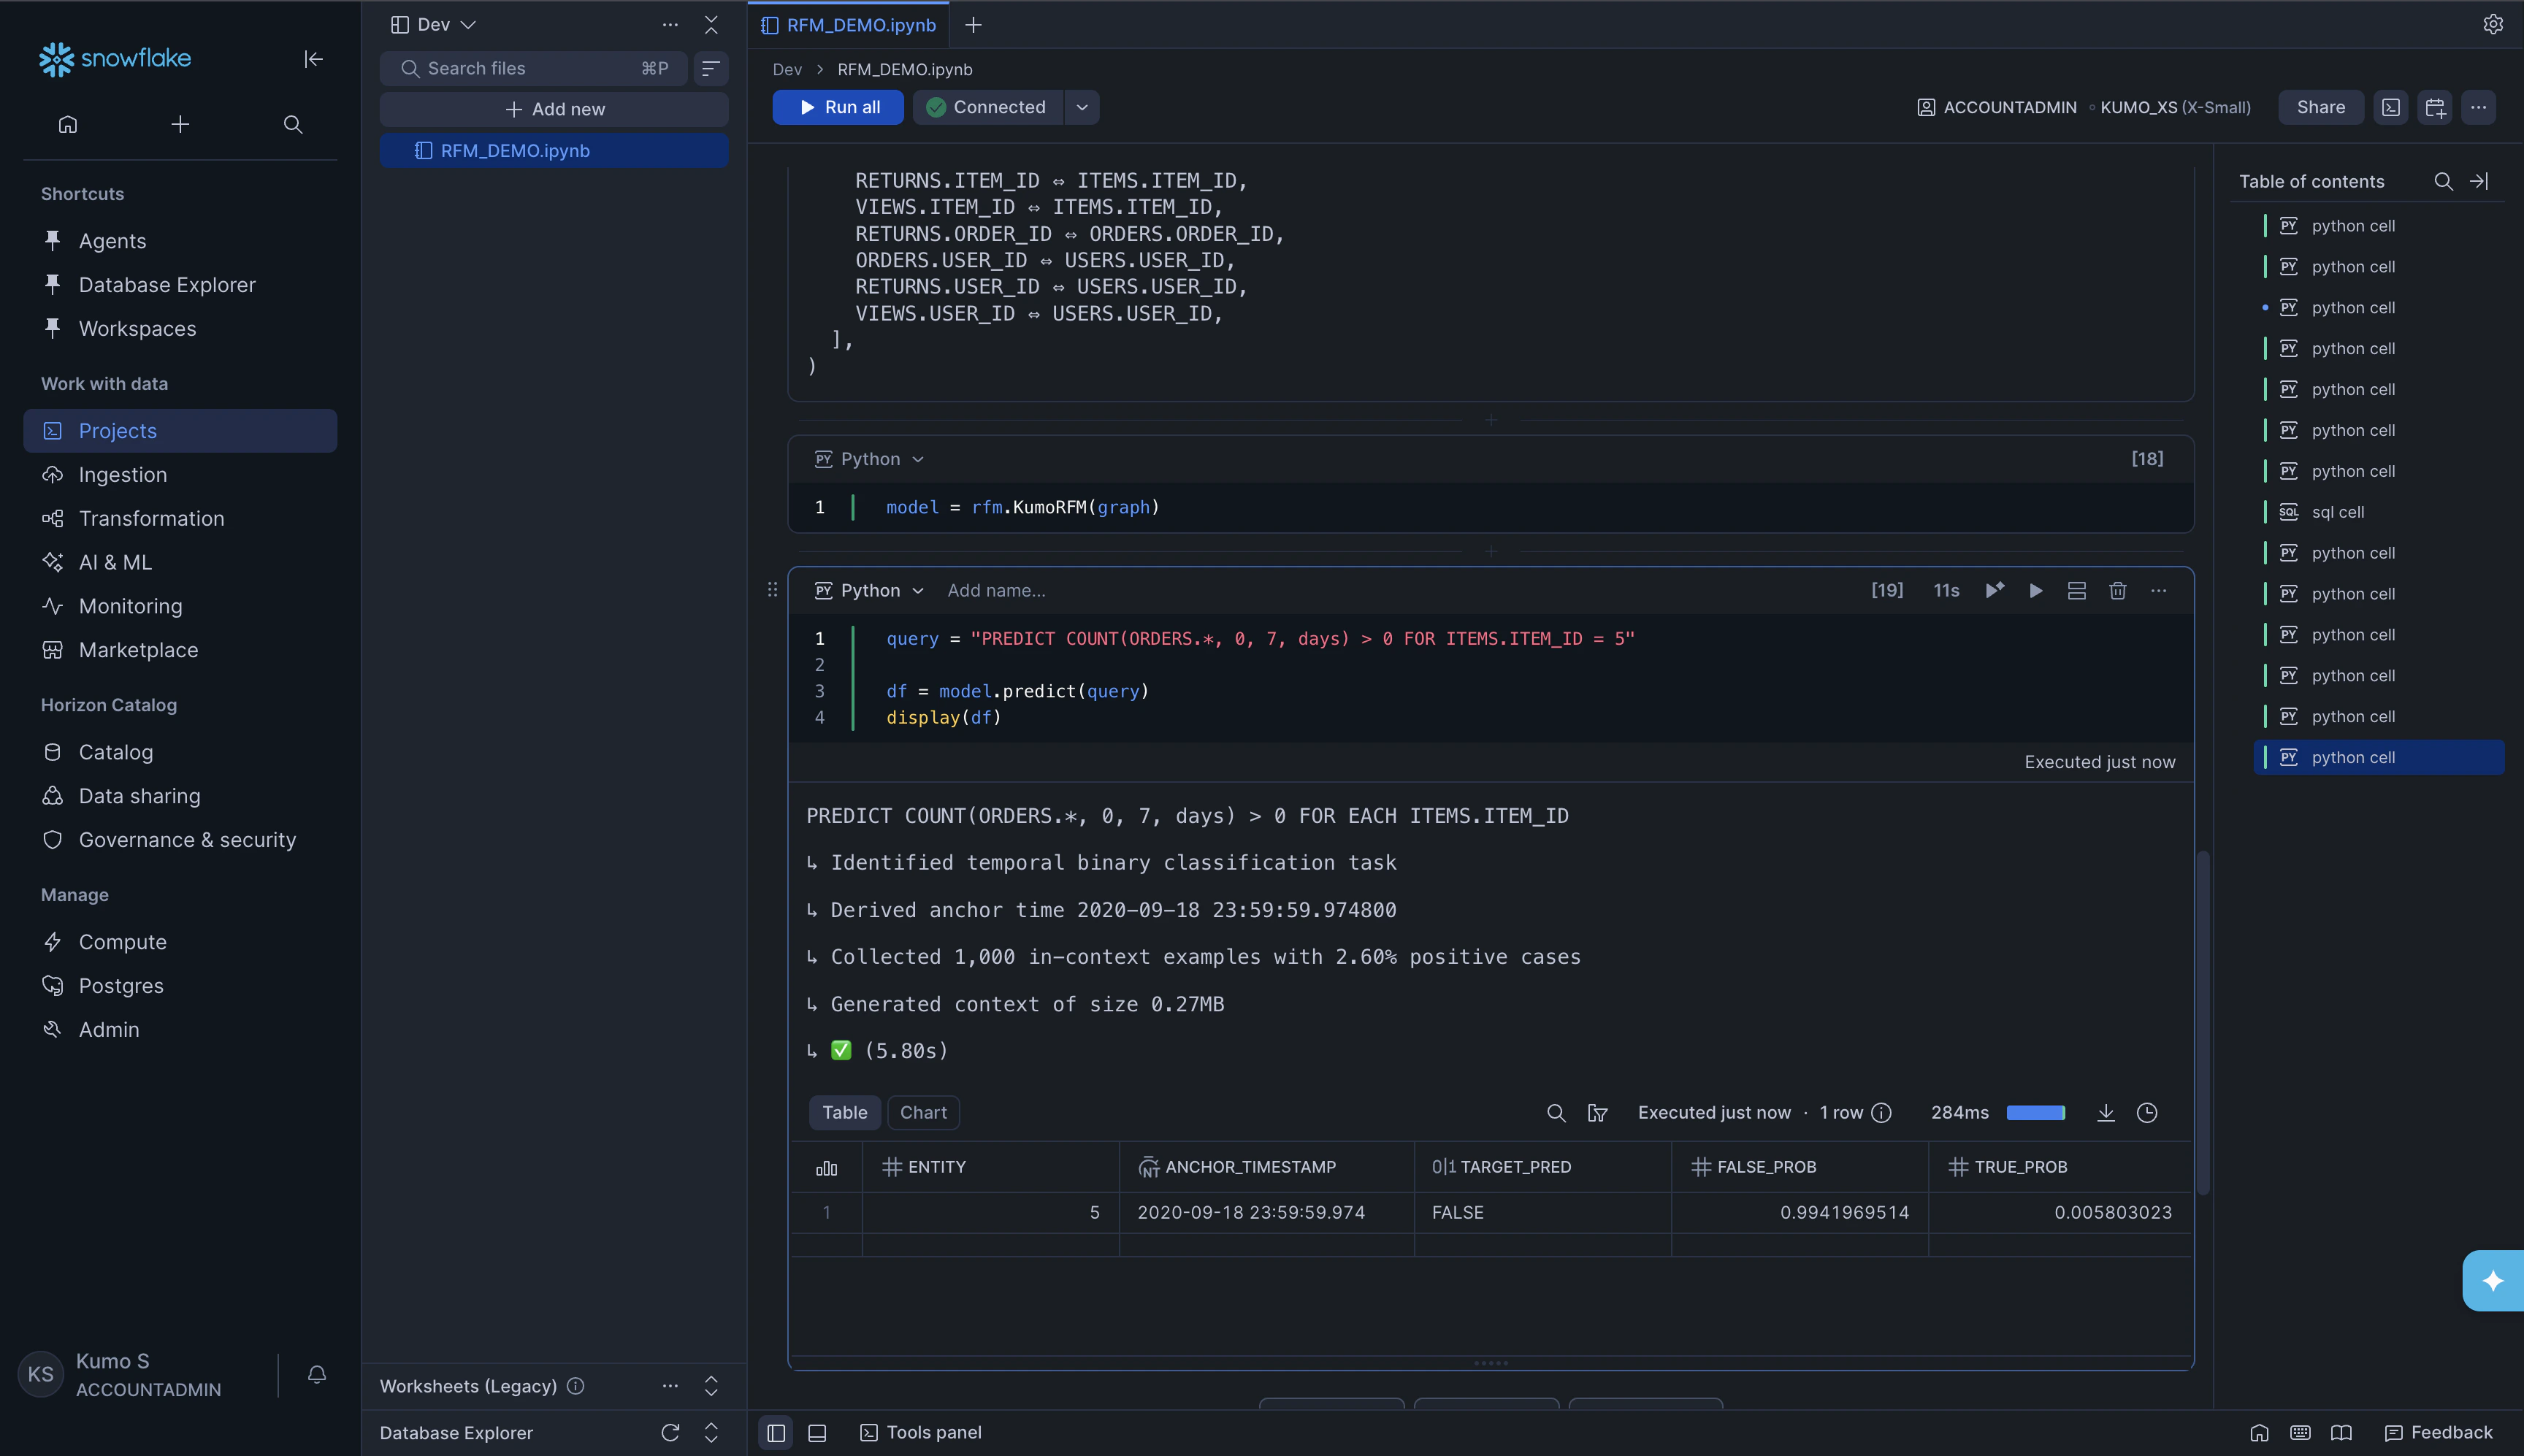
Understanding the Prediction Output
Regardless of which option you used above, the prediction result is always a pandas DataFrame. The columns depend on the type of prediction:What’s Next
- Make Predictions - Learn PQL syntax in detail
- Prediction Types - All supported prediction types (classification, regression, forecasting, and more)
- Filters and Operators - Filter and refine your queries
- Evaluation - Evaluate prediction quality
- Configuration - Run modes, explainability, batch predictions
- Snowflake Connector - More details on Snowflake table configuration